Stagflation Scorecard: Effects, Risks and
Parallel to the late 1970s
By the Curmudgeon
with Victor Sperandeo
Market Recap:
It was a very bad week for
stocks and bonds after the Fed’s largely unexpected 75 basis points (bps) rate
hike was leaked by the Wall Street Journal on Monday morning. [Fed Chair Powell said in May that a 75-bps
rate hike in June was “off the table.”]
It was the largest Fed Funds rate hike since 1994.
The NASDAQ Composite and
S&P 500 had their 10th losing week in the past 11, while the Dow Jones
Industrial Average had its 11th down week in the past 12.
Other markets showed
distinctly recessionary traits (more on recession risks below). After
shooting higher ahead of the Fed’s telegraphed rate hike, Treasury yields fell
sharply as the market pulled back its expectations of future tightening. The
two-year note, the coupon maturity most sensitive to Fed moves, rose 11.7 bps
in yield on the week, to 3.164%, but that was off 27.1 bps from Tuesday’s
close. The benchmark 10-year yield was up 8.2 basis points (bps), to 3.238%,
but down from the 3.482% recorded on Tuesday June 14th.
Oil prices were
hit with a deflationary downdraft. Nearby crude-oil futures ended the week at
$109.56 a barrel, down 9.21% for the week and far below the spike to $130 in
early March. That was reflected in energy shares, which were one of the few
sectors higher this year. The Energy Select Sector SPAR XLE –5.47% exchange-traded
fund (ticker: XLE) fell 17.16% on the week and ended down 20.36% from its closing
peak hit on June 8, which had represented a double from last year’s low.
Dr. Copper, that most
economically sensitive commodity, fell 6.6% on the week and was down 18.5% from
its early March high.
Stagflation Produces a Sea of
Red:
In stagflation, all
assets (with few exceptions) lose. There
are no long side hedges or decline resistant “balanced” portfolios. A 60/40
portfolio suffers double digit losses, as it has this year and during the late
1970s through early 1980s.
According to a research note
from Bespoke Investment Group, a 60/40 portfolio suffered a
negative total return of 17.8% since the beginning of 2022, the worst start to
a year since 1976 and the second-worst six-month showing since then. Not even
the 2007-09 financial crisis was as painful for such a 60/40 portfolio, the
advisory noted. That’s because both
portions of the portfolio have been losers this year.
Indeed, 2022 has been a sea of
red for almost all asset classes. Let’s assess the damage:
- Joseph Carson, a former chief economist at AllianceBernstein, estimates that households may have
lost more in equities and crypto this year than the $6 trillion total
decline in equity wealth from the bursting of the dot-com bubble at the
beginning of this century.
- Wilshire Associates estimates US. equities
have lost $12.5 trillion in valuer this year and $13.1 trillion
from their November 2021 peak (popular stock indexes peaked the first week
of January 2022).
- Carson thinks the effects of the rate hikes
already taken and those likely ahead, along with the loss in wealth that
he estimates could reach $15 trillion to $20 trillion, would be
enough to stop the consumer, the economy, and the Federal Reserve.
- At Friday’s close of 3,674.84, the S&P
500 has declined -23.4% since its January 3, 2022, all time high of
4,796.56. That’s more than the average -16% bear market decline in midterm
election years, according to BofA Global Research.
- US government bonds, long considered
the safest of investments, have lost ~12% in 2022, according to a Bloomberg
index of US Treasuries which is having its worst year ever.
- The iShares Core US. Aggregate Bond
exchange-traded fund (ticker: AGG), which represents the broad taxable
investment-grade debt market with $83 billion in assets, has had a daily
Year to Date (YTD) Total Return of -11.59%,
according to Yahoo Finance.
- Bitcoin has lost more than two-thirds of its value
since it almost touched $70,000 per token seven months ago.
By now, I think readers get
the message loud and clear: There’s been
“no place to hide” since earlier this year when the “Free Money Party”
ended and “the FAANG trade started to show cracks,” as noted by the Curmudgeon here
and here.
Parallels to the late 1970s:
Unexpectedly high inflation
(see chart below), oil price shocks, declining real wages, slowing economic
growth, huge tightening of monetary policy and turbulence in stock and bond
markets characterize today’s world economy.
Those were also the dominant
themes of the world economy and financial markets in the late 1970s. That
period ended in August 1982 after a brutal monetary tightening in the US., a
sharp reduction in inflation (due to our hero
x-Fed Chairman Paul Volker RIP, who raised rates while reducing the
growth of the money supply) and a wave of debt crises in developing countries,
especially in Latin America. Could
the same fate await today’s world economy and financial markets?
Inflation is well above target
in almost every country. As in the 1970s, this is partly due to one-off shocks
— then two wars in the Middle East (the Yom Kippur war of October 1973 and the
Iran-Iraq war which began in 1980), this time the COVID pandemic and Russia’s
invasion of Ukraine.
Policymakers tended to blame
inflation on temporary factors then, just as we have seen more recently with
Fed chairman Powell insisting (for a very long time) that inflation was
“transitory.” See Victor’s Analysis below.
Most important is the danger
that today’s inflation will become embedded in expectations and will therefore
persist. Such inflationary psychology
was prevalent throughout the 1970s and early 1980s, which made the Fed’s
inflation fight much more difficult and painful.
Analysis of World Bank Report:
The World Bank’s Global
Economic Prospects report
“Stagflation Risk Rises Amid Sharp Slowdown in Growth,” addresses
the problem of high global inflation and lower economic growth.
The report states: “The
removal of monetary accommodation in the United States and other advanced
economies, along with the ensuing increase in global borrowing costs,
represents another significant headwind for the developing world. In addition,
over the next two years, most of the fiscal support provided in 2020 to fight
the pandemic will have been unwound. Despite this consolidation, debt levels
will remain elevated.”
Victor notes that a
big difference between the past high inflation environment from 1978-1982 and
now is the US debt levels. In particular, a debt to
GDP ratio of about 34% then vs 130% today.
The World Bank report says:
“Reducing the risk of stagflation will require targeted and impact measures by
policy makers across the world.”
Interestingly, the measures
recommended by the World Bank do not include aggressive tightening of
monetary policy. In fact, that could
cause acute financial stress they say.
“The simultaneous
materialization of several downside risks could result in a much sharper and
more prolonged global slowdown.”
“In
particular, faster tightening of US. monetary
policy [1.] could cause acute financial stress in Emerging Market
Developing Economies (EMDEs).”
Note 1. Astonishingly, Fed Funds Futures now imply an
86.2% probability of a 75 bps Fed Funds rate increase
at the July FOMC meeting vs only a 0.5% probability one month ago! On Saturday, Fed governor Christopher Waller
said he would support another 75-bps rate rise at the central bank’s
next meeting in July if, as expected, data showed that inflation had not
moderated enough.
………………………………………………………………………………………………….
It’s a
given that more and bigger Fed rate hikes will cause a decline in US GDP and an
increase in unemployment. How painful might that be? “If monetary policy tightening were
substantial and prolonged, messy and costly debt crises are likely to emerge,”
according to Martin Wolf of the Financial Times (on-line subscription
required).
One encouraging sign today is
that the price of oil, while still elevated, may be peaking.
Victor’s Analysis:
In the context of all the
negative analysis is the fact that, in most cases, stock valuations are still
at historic highs! The P/Es of many stocks continue to be at nosebleed
levels. For example, the Walt Disney
Company (DIS) P/E is currently 63.74 despite that its stock price of $94.34 on
Friday is down 50% from its 52-week high!
Also, there’s a huge
difference between the honesty and knowledge of the Fed Chairmen then and now.
In October of 1979, Fed Chairman Paul Volcker returned from Europe where he was
thoroughly castigated for US inflation, which was adversely affecting the rest
of the world. Volker immediately stated that he would attack inflation by
limiting MONEY SUPPLY growth. Although
painful for the US economy and financial markets, it worked!
Today, Fed Chairman Powell has
the CHUTZPAH to suggest that there is no correlation between money supply
growth and inflation anymore. Since when? That strong correlation has been proven a
dozen times since the 1920’s by many prominent economists, including John
Maynard Keynes.
Any honest economist knows
that increasing the money supply faster than the growth in real output (GDP)
will cause inflation to rise. The reason is that there is more money chasing
the same number of goods and services. Therefore, the increase in monetary
induced demand causes companies to increase prices.
Also, the first sentence in
the Fed Chairman’s June 15th press release (after raising rates by
75 bps) is a total lie: “Overall economic activity appears to have picked up
after edging down in the first quarter.” Every economic number released last week
shows the exact opposite-- that the US economy is weakening! Loretta Mester, President of the Cleveland
Fed, contradicted Powell on Sunday’s CBS Face the Nation program, “We do
have (economic) growth slowing . . . and
that’s OK, we want to see some slowing of demand to get in better line with
supply.”
Let’s also not forget Powell’s
often repeated claim that “inflation is transitory,” which was his excuse for
continuing QE till March 2022 and NOT raising rates earlier (despite so many
Fed critics that urged him to do so).
I strongly believe that
Powell’s ignorance of the money supply/ inflation correlation and his
misleading statements should force him to resign! Powell is without doubt the worst Fed
Chair in the last 90 years – and I’m being polite! (the
Curmudgeon concurs).
Conclusions:
The echoes of the late 1970s
are very apparent today: higher than expected inflation, big oil shocks,
weakening economic growth, and crashing financial markets.
The key unknown now is whether
the Fed’s new aggressive rate rising policy will cause a much deeper and longer
bear market in equities. To prevent
that, the Fed must tone down its rate rising rhetoric.
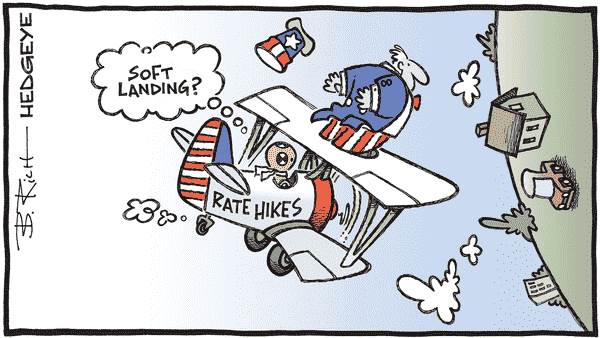
We don’t think there will be
anything close to a “soft landing” for the US. economy.
Furthermore, Victor and I
believe that the Fed will cause a recession this year or has already
done so. We think the US is likely to
experience two consecutive quarters of negative GDP in the first half of 2022
(1st quarter -1.5% annual rate with Atlanta Fed GDP Now forecasting
0% GDP growth for 2nd quarter).
That is primarily due to the Fed’s abrupt and unexpected change in
monetary policy.
As the chart below indicates,
the Fed has been joined by other global central banks which collectively have
raised short term interest rates 124 times this year.
Closing Quote:
“Stifling domestic demand with
too-late rate hikes could now result in a prolonged recession,
especially because policy works with a three-to-nine-month lag on the economy,”
Anionic Capital’s Peter Cecchini said, adding that the Fed’s
stubbornness to wait so long to raise interest rates could lead to a costly
policy whipsaw.
Source: Business Insider
……………………………………………………………………………………………..
Be well, stay healthy, try to
find diversions to uplift your spirits, wishing you peace of mind, and till
next time………
The Curmudgeon
ajwdct@gmail.com
Follow the Curmudgeon on Twitter @ajwdct247
Curmudgeon is a retired investment professional. He has been involved in financial markets since 1968 (yes, he cut his teeth on the 1968-1974 bear market), became an SEC Registered Investment Advisor in 1995, and received the Chartered Financial Analyst designation from AIMR (now CFA Institute) in 1996. He managed hedged equity and alternative (non-correlated) investment accounts for clients from 1992-2005.
Victor Sperandeo is a historian, economist and financial innovator who has re-invented himself and the companies he's owned (since 1971) to profit in the ever changing and arcane world of markets, economies, and government policies. Victor started his Wall Street career in 1966 and began trading for a living in 1968. As President and CEO of Alpha Financial Technologies LLC, Sperandeo oversees the firm's research and development platform, which is used to create innovative solutions for different futures markets, risk parameters and other factors.
Copyright © 2022 by the Curmudgeon and Marc Sexton. All rights reserved.
Readers are PROHIBITED from duplicating, copying, or reproducing article(s) written by The Curmudgeon and Victor Sperandeo without providing the URL of the original posted article(s).