Popular FAANG Trade is Starting to Show
Cracks
By the
Curmudgeon
WSJ - Big Tech Trade Is Losing Its Luster:
The stock market’s popular FAANG
trade is starting to show cracks. Investors say they are reconsidering their
approach to trading big technology stocks after a week marked by giant swings
in share prices.
The NYSE FANG+ Index,
which tracks popular big tech stocks, has tumbled 10% this year, underperforming
the broader market. Some stocks in the group, like Netflix and Meta, are off at
least 38% from their highs. The S&P 500, in contrast, is down 6.2% from its
record high earlier this year.
“As a group, it was very
strong over the past 10+ years,” said Amy Kong, chief investment officer of
Barrett Asset Management. “At this juncture, you are starting to see some
cracks.”
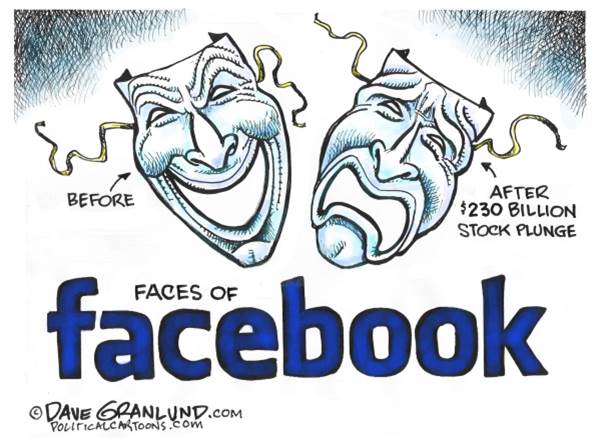
One of the biggest ruptures
came after Meta’s (FB) disappointing earnings report (see subhead below) when
investors shaved more than $230 billion off the social-media giant’s market
value (-26.4% on Thursday), the biggest-ever loss for a U.S. company in a
single session.
The meltdown in high flying
technology stocks like Facebook is just the start of the financial changes that
will probably result from the Federal Reserve’s decision to end a prolonged era
of free money and make borrowing more expensive.
“The market has been very
comfortable ignoring valuations on the things that have delivered growth
through the pandemic (big tech stocks) … It feels like the world is
entering a different environment than the one we’ve been in,” said Roger
McNamee, co-founder of Elevation Partners, a private equity firm in Menlo Park,
California. “The pricing of risk is changing.”
The Fed’s easy money stance
helped fuel an extraordinary bull market in stocks. From its pandemic low in
March 2020 to the beginning of last month, the Dow Jones industrial average
roughly doubled in value.
Both the Fed and the
International Monetary Fund warned in recent months that stock prices could be
losing touch with their fundamental values. Relative to earnings forecasts,
prices were at “the upper end” of historical experience, the Fed said in
November, adding: “Asset prices may be vulnerable to significant declines
should risk appetite fall.”
Facebook suffered the biggest
impact, with its stock falling 26.4% on Thursday, erasing more than $230
billion in value. Adjusted for inflation, that’s equal to the entire stock
market’s loss on Black Tuesday in October 1929.
“Having witnessed the Fed’s big
mis-characterization of inflation for most of 2021, concern is mounting that it
will now make a second policy mistake — that of pivoting hard from policy
inaction to being forced into a bunch of measures that will damage the much needed inclusive economic recovery,” Mohamed El-Erian,
chief economic adviser at Allianz, said via email. “Very few asset classes are
immune to a twin blow of a Fed policy mistake and patchy market liquidity.”
BofA- Global Growth is Slowing
(via email and research report to clients):
BofA Global Proprietary
Signals reflect the downward drift in global growth succinctly. Although 78% of the
41 growth indicators still flag a ‘Bullish’ or ‘Neutral’ signal, the proportion
of outright ‘Bullish’ signals has fallen off steadily from 81% last May to just
46% today. One of the many indicators we are watching closely is the Global
Wave, which weakened for a second consecutive month after peaking in December,
suggesting more cautious positioning for investors. In addition to Fed rate hikes
and quantitative tightening potentially on the horizon for the US, we are also
seeing cracks elsewhere. The Euro Area GDP Tracker has reverted to a
‘Bearish’ signal and the Japan Factory Automation Indicator continued to
fall under the clutches of weaker macroeconomic settings. In short, the global
economy may be entering a period of slower activity.
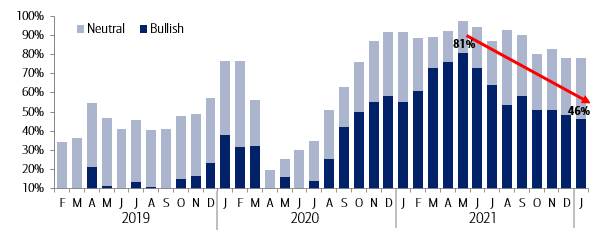
Note:
Based on 41 growth indicators. Source:BofA Global Research.
In short, the message is loud and clear - the global economy may be
entering a period of slower activity. To gauge the market impact of such a
move, BofA references their segment analysis from last month, where they
dissected the growth cycle (defined using the US ISM Manufacturing PMI) into
four distinct parts - accelerating from the base (defined as 50) to the peak
(Arc 1), slowing down from peak to base (Arc 2), contracting from base to
trough (Arc 3), and recovering from the trough to base (Arc 4). Please refer to
bottom left chart below.
BofA Chart & Table: Delineating the market impact of
a growth slowdown
→Historically, steep corrections have happened in
arc 2
Not only are the
point-to-point returns associated with Arc 2 unimpressive (world average
annualized returns of -4% with 35% hit ratio for 20 episodes), but they also
come with steep average drawdowns of 18%.
if history is any guide, global equities could be in for another c.10%
correction from here.
Technicals are
Broken:
BofA analysts have been
highlighting the deterioration in market breadth since November. The new year
has witnessed a further leg down in the tape, with 58% or 28 out of 48 markets
in the MSCI AC World Index now above their 200-day moving averages, down from
84% on 11 November. We also observe an accumulation of new 52-week lows in the
S&P 500 Index, as the plunge in speculative assets spills over to the
broader market, including the mega-cap tech stocks. And lest we forget, even
seasonality trends are out of favor this year.
Since 1930, the average draw down in a U.S.
mid-term election year is a staggering 20%.
Bottom-line. A
hawkish Fed combined with a slowing growth profile and weak technicals
is a perfect recipe for corrections/bear markets. Prudent risk management calls for defensive
positioning in such a scenario. The environment is not conducive for risk
assets.
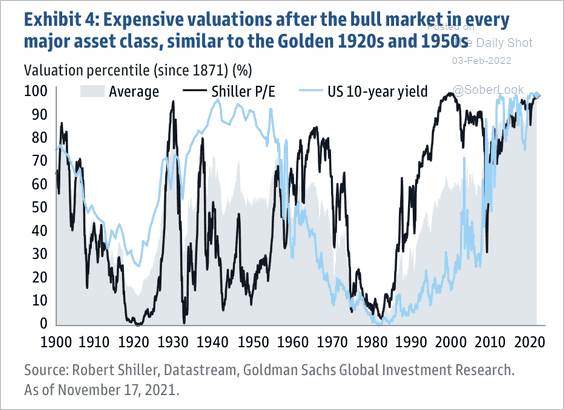
'Valuations across all asset
classes have been near record highs.' https://thedailyshot.com/2022/02/03/does-higher-inflation-mean-a-shorter-expansion-cycle/
via @SoberLook
Stay healthy, enjoy life,
success, good luck, and best wishes.
Till next time....
The Curmudgeon
ajwdct@gmail.com
Follow the Curmudgeon on Twitter @ajwdct247
Curmudgeon is a retired investment professional. He has been involved in financial markets since 1968 (yes, he cut his teeth on the 1968-1974 bear market), became an SEC Registered Investment Advisor in 1995, and received the Chartered Financial Analyst designation from AIMR (now CFA Institute) in 1996. He managed hedged equity and alternative (non-correlated) investment accounts for clients from 1992-2005.
Victor Sperandeo is a historian, economist and financial innovator who has re-invented himself and the companies he's owned (since 1971) to profit in the ever changing and arcane world of markets, economies and government policies. Victor started his Wall Street career in 1966 and began trading for a living in 1968. As President and CEO of Alpha Financial Technologies LLC, Sperandeo oversees the firm's research and development platform, which is used to create innovative solutions for different futures markets, risk parameters and other factors.
Copyright © 2022 by the Curmudgeon and Marc Sexton. All rights reserved.
Readers are PROHIBITED from duplicating, copying, or reproducing article(s) written by The Curmudgeon and Victor Sperandeo without providing the URL of the original posted article(s).