How Does the
Bull Market Look Now?
By the Curmudgeon with Victor Sperandeo
Introduction:
Is the bull
market over? Has the tech stock bubble
burst? What's next for the market? These are questions many people are asking in
the wake of last week's volatility and sharp declines on Thursday and Friday,
which followed a big up move on Wednesday. While we don't have the answers (we
don't think anyone does), Victor and I would like to share our thoughts on the
five+ year bull market in U.S. equities and the outlook going forward,
especially for tech stocks.
A Healthy or Artificial Bull Market?
We strongly
believe that this has not been a bull market based on solid economic
fundamentals, as we've pointed out in so many posts related to the "Great
Disconnect" between the real economy and the equity market. Instead, this bull run
has been fueled, aided and abetted by Federal Reserve monetary policies (ZIRP
and QE), record high margin debt and corporate share buybacks. We'll focus on the latter two in this
article, as past posts extensively covered the Fed and the markets.
1. Margin Debt:
The chart below
shows the tight correlation between end of month NYSE margin debt and the
S&P 500. Note that NYSE margin debt
now is substantially above the previous peak in July 2007- even though share
volume is a fraction of what it was then.
That implies that today's stock market is much more heavily leveraged
than any time in decades.
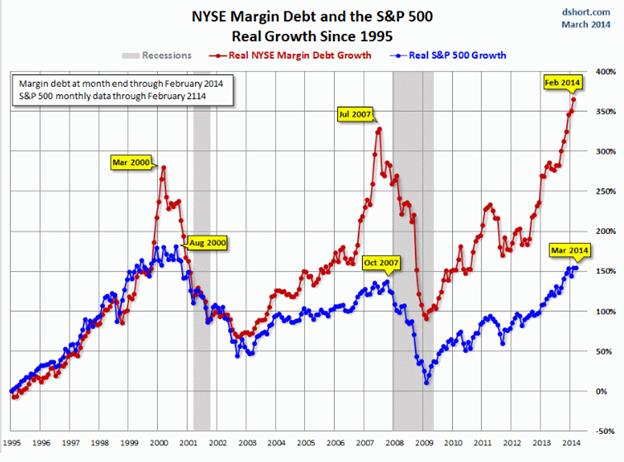
Chart courtesy of dshort.com
If one were to include NASDAQ margin debt, it would show even more leverage has been used to buy stock. As we've pointed out in a Curmudgeon post almost one year ago, Margin Debit is a Double-Edged Sword. It’s important to note that the topping of margin debt in March 2000 and July 2007 preceded a significant drop in the S&P by several months (the caveat is that Margin Debt reported data is always a month old).
2. Share Buybacks:
What effect
have corporate share buybacks had on stock prices and earning per share? They
boosted demand while contracting the supply of stock and made earnings per
share higher than they'd otherwise be.
In his WSJ
Ahead of the Tape column on April 7th (on line subscription required),
Spencer Jakab wrote:
"During
the reporting season that just ended, earnings growth slowed to a crawl and
likely would have been negative without buybacks. The bang for the buyback buck is diminishing,
though, requiring more cash to remain effective. During the 12 months through
January, S&P 500 companies spent a whopping $478 billion to repurchase
3.1% of shares outstanding. A year
earlier, they spent about $90 billion less for the same percentage reduction.
Given today's higher values, companies will have to spend tens of billions
more. If buybacks slow, so will earnings growth, all else being equal."
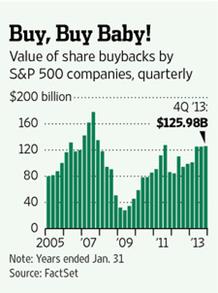
Jakab notes that
during the previous bull market (which ended in October 2007), buybacks peaked
in the same quarter the stock market did. Less than two years later, during the
quarter in which stock prices bottomed, companies spent 83% less on buybacks.
That is despite the fact they would have gotten far more earnings-boosting
effect at those low prices for each dollar spent. Please see chart below:
Decline in
Tech Stocks:
We think the
rout in tech stocks is just getting started.
This week's Barron's cover "The Tech Stock Bust Should be no Surprise" calls attention to what we
wrote about this past January: Tech Bubble 2.0 Will End Badly
Just Like the First Tech Bubble. And that was BEFORE Facebook's $19B
acquisition of WhatsApp (mobile messaging) and $2B purchase of Oculus VR (virtual reality game headwear).
What's happened
since then: In the past few weeks, an abrupt
change in sentiment has caused falls of 20%-45% in former tech darlings like
Netflix, Facebook, Twitter and LinkedIn. The tech-heavy Nasdaq
composite index closed at nearly 4,358 early last month, its highest level
since the 2000 peak, and has shed nearly 360 points - or 8% - since then.
Other Voices
on the Tech Stock Decline:
This weekend's
Financial Times Lex column noted: "Without a clear catalyst for the
sell-off, one implicit marker should be Facebook’s second recent billion-dollar
acquisition, Oculus Rift. Founder Mark Zuckerberg threw down $2bn for the
virtual reality headgear (goggles) concept on March 25th. Facebook shares since
that day are down over 10%."
Now that
government-backed bond purchases (Fed's QE) are tapering off, people are starting
to realize "the only thing holding this balloon up is the Fed blowing air
in it," said Fred Hickey, editor of The High-Tech Strategist newsletter.
"It's the most insane pricing I have seen since 2000," Hickey said regarding
technology stock prices.
“March was a
wake-up call from the market to many long-short funds that had been relying on
certain stocks and sectors for the past couple of months,” says Matthew Elstrop, an analyst at Liongate
Capital Management, a fund of hedge funds with $7bn of assets invested in the
sector. “A lot of crowded trades, such as high growth tech stocks, just went
into reversal.”
John Paulson,
the hedge fund manager who built his reputation betting heavily against the
U.S. housing bubble before the financial crisis, saw his $2.8bn Advantage Plus
fund (which is focused on so-called event driven or momentum trading), drop by
7.4% in March, according to the Financial Times.
Research from Morgan
Stanley’s prime brokerage suggests that few hedge funds have started to offload
their so-called “new tech” shareholdings yet, although that may change if these companies
continue to fall in value. “So far we
haven’t seen big changes in hedge fund positions,” says Mr. Ince.
"In fact, they may actually like some of the technology shares even more
now they are cheaper.”
Curmudgeon's
Opinion: Such "buy
the dips" mentality implies to us that the tech stock decline is not over
yet. For that to happen, we'd like to
see much more pessimism and urgent selling.
The Smart
Money Flow Index (SMFI):
One measure of
sentiment that we've started to watch closely is Bloomberg's Smart Money
Flow Index (SMFI). It is calculated
by taking the price of the Dow Jones Industrial Average at 10am (Eastern Time)
on any given day, subtracting it from the previous day's close, and adding it
to the next day's closing price. The
first 30 minutes represent "emotional buying," driven by greed and
fear of the crowd; veteran traders (i.e. the smart money) typically wait until
the end of the day to place their orders.
As the chart
below shows the DJI and SMFI rallied in unison to make dual highs in May
2013. While the Dow continued to push
higher, the SMFI made lower highs and has collapsed since late Feb 2014. It is now at its lowest close since Nov 27, 2012.
It's the greatest gap since 2007.
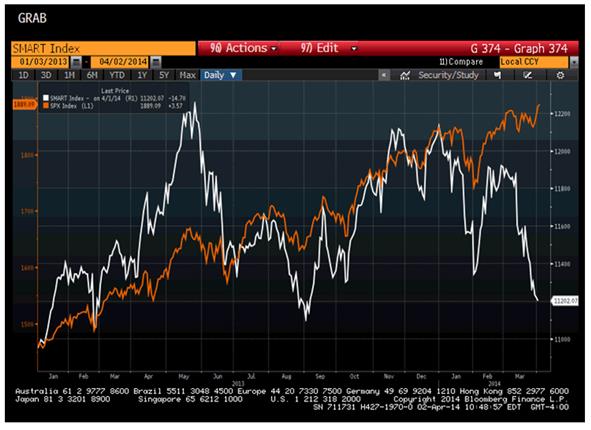
Chart courtesy of
Bloomberg
Dennis
Slothower of Alpine Capital
wrote in an email to the Curmudgeon, "Smart money waits until the end of
the trading day and they very often test the market before then by shorting
heavily just to see how the market reacts. Then they move in the big way. These
heavy hitters also have the best possible information available to them and
they do have the edge on all the other market participants. To replicate this
index, just start at any given day, subtract the price of the Dow at 10AM from
the previous day's close and add today's closing price. Whenever the Dow makes
a high which is not confirmed by the SMFI there is trouble ahead."
Minyanville's Todd
Harrison: "There is no Holy Grail
when investing, but there are on occasion, signals that provide the right
insight at the right time. This (divergence) may be one of them."
Victor's
Closing Comments:
The bull market
must be taken into context of zero short term interest rates during the last
six years and well into 2015, according to Fed Chairwoman Janet Yellen. Add three QE's and other Fed schemes, such as
"operation twist" (which was done twice in an attempt to lower long
term interest rates) and you can understand how this bull market was nurtured
and sustained.
Yet despite
this extraordinary ultra-easy monetary policy, the U.S. economy has only grown at
approximately 2.2% since the "recession ended" in June 2009. The BEA said that "Real GDP"
increased 1.9% in 2013 compared with an increase of 2.8 percent in 2012.
Editor's
Note: By comparison, the S&P 500 rose 30% in
2013 and 13% in 2012.
But has U.S.
GDP growth really been as strong as reported?
We don't think so.
The U.S.
government stated annual inflation rate has been 2.2% since June 2009. If inflation is higher than that (we think it
is and others do too), then real GDP would be even lower than reported. That would make the "great
disconnect" between the super strong stock market and weak economy even
more glaring.
There are other
factors to consider when determining the "Real GDP." For example, the U.S. government includes
about 15% of "imputations" (goods and services that are not traded in
the market place) in the published
GDP rate, even though sales never really occurred. "GDP Imputations"
approximate the price and quantity that would be obtained for a good or service if it was traded in the market place. These "GDP Imputations" are
government manipulations of numbers on the highest order, in my humble opinion.
Together with
all the manipulations of interest rates, bonds, the dollar, gold and other
items (stock indices?) the government's flawed GDP numbers really make all
fundamental analysis and assumptions worthless!
The crucial
issue for today's stock market is to honestly and objectively analyze what has
happened, ask why, and attempt to determine if the market move has been based
on sound economic fundamentals or something more akin to a "tulip
bulb" mania?
Market timing
is something else and quite difficult, especially with unexpected Fed
intervention in the markets or moving to an even more dovish monetary policy
(like a stop in tapering). The onset of
a bear market in equities will truly occur when Janet Yellen can't control the
events. Other than that, everything is risky and very hard to predict. Being
hedged is the only prudent thought I have to recommend at this moment.
Till next
time........................
The Curmudgeon
ajwdct@sbumail.com
Curmudgeon is a retired investment professional. He has been involved in financial markets since 1968 (yes, he cut his teeth on the 1968-1974 bear market), became an SEC Registered Investment Advisor in 1995, and received the Chartered Financial Analyst designation from AIMR (now CFA Institute) in 1996. He managed hedged equity and alternative (non-correlated) investment accounts for clients from 1992-2005.
Victor Sperandeo is a
historian, economist and financial innovator who has re-invented himself and
the companies he's owned (since 1971) to profit in the ever changing and arcane
world of markets, economies and government policies. Victor started his Wall Street career in 1966
and began trading for a living in 1968. As President and CEO of Alpha Financial
Technologies LLC, Sperandeo oversees the firm's research and development
platform, which is used to create innovative solutions for different futures
markets, risk parameters and other factors.
Copyright © 2014 by The Curmudgeon and Marc Sexton. All rights reserved.
Readers are PROHIBITED from duplicating, copying, or reproducing
article(s) written by The Curmudgeon and Victor Sperandeo without providing the
url of the original posted
article(s).