Margin Debit is a Double-Edged Sword
by The Curmudgeon
On May 24th,
the New York Stock Exchange (NYSE) reported margin debt statistics for April
2013. As expected, April's margin debt
hit a new high at $384.37B -- a 1.3% gain from the previous month, a 29% rise
from the same month last year, and above the previous all-time high
in June 2007 of $384.10B. NYSE
member brokerage firms report the levels of margin debt held against client
accounts monthly. The data can be found here.
The rising
level of margin debt is seen as a measure of investor confidence, as
speculators are more willing to borrow to make (or maintain)
"investments" when share prices are rising. In effect, they have more
$s worth of financial assets in their portfolios to borrow against. The latest
rise has been fueled by record low interest rates and a 17% year-to-date
stock-market rally (with flat to down corporate profits and GDP limping along
at <2%). In essence, greed is feeding
on itself as speculators take on more leveraged long positions.
Given the stock
market had very strong gains in May, we are almost certain that current margin
debt has reached a substantially higher all-time high. But there's more, much more......
·
According
to Alan Newman of Cross-Points: "When measured versus GDP, margin debt is
at the same levels the market reversed and collapsed in 2000 and 2007. But even
those comparisons pale in the face of the chart below, showing margin debt
relative to total stock market capitalization."
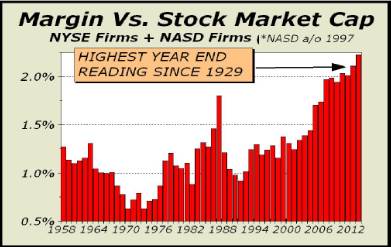
Chart Courtesy of Cross-Currents
·
Total
NYSE volume has dried up considerably since the last market peak in Oct 9,
2007. For example, total NYSE volume on
Oct 19, 2007 was 2,625,101,750 shares traded.
Contrast that to this year, where an average of ~1T shares has been
traded each day (Source: NYSE).
That's over a 40% decline in average daily volume on the NYSE! It means that less trading has been driving
stock prices up, but that can work in reverse too.
·
The
NYSE Margin - to -Volume ratio in April 2013 is more than 2 1/2 times what it
averaged in October of 2007. This
implies that in a down market, it will take much fewer shares traded (than in
2007) to cause forced selling due to margin calls. [Note that forced selling can also come from
mutual fund redemptions, since mutual fund cash has been consistently
below 4% of assets- even as assets increased due to rising stock prices].
·
FINRA
reported
that the sum of all Debit Balances in margin accounts (the amount of
money margin account customers owe the brokerage firm) also made a new high in
April, reaching a staggering total of $408.677B. Compare that with the bear market low in
March 2009 when that number was only $21.8B!
·
More
startling was that FINRA's Free Credit Balances in customers' margin
accounts hit a new low for this year in April, at $191.719B! When you subtract that number from April's
Debit Balances you get $216.958B of net leverage- another all-time high!
·
In a
somewhat academic report
on this topic, Alhambra Partners states: "Banks and brokers can “create”
cash out of nothing, through margin balances. The relative comparison between
cash in brokerage accounts and margin usage reveals more depth to investor
sentiment. In the big picture, extremes in cash vs. margin match up
extremely well with market inflections (major highs or low in stock
prices)." There are some very
interesting historical charts within that article, which illustrate previous
extremes in cash vs. margin debt led to market inflection points.
What's not
known today is how much margin debt has been used to purchase leveraged
securities that trade on the NYSE, like ultra-long ETFs and leveraged closed
end funds. Other types of speculation
are also possible. An advisor quoted in
the WSJ said "he advised a client to use margin debt to help finance
flipping houses, since the client could borrow money more quickly on margin
than he could by taking out a different type of loan."
Another huge unknown
is how much margin is used in so called "black pools," which trade
off the exchanges, e.g. HFT and investment bank to investment bank computerized
trades. We are concerned that during a
severe market decline, off exchange trading will all but cease, which would
exacerbate any sell off.
Closing
Comment: Any way you want to look at it, leverage
being used today is staggering. Has
everyone forgot what happens when speculators get a "margin call" due
to falling prices of the securities they own using borrowed money? There now seems to be little margin for error
(pun intended) in a down market, before forced selling is required. That could
create a downdraft that might spin a healthy pullback into a more significant
correction, a mini-crash, or even a protracted bear market.
Till next time.....................................
The Curmudgeon
Curmudgeon is a retired investment professional. He has been involved in financial markets since 1968 (yes, he cut his teeth on the 1968-1974 bear market), became an SEC Registered Investment Advisor in 1995, and received the Chartered Financial Analyst designation from AIMR (now CFA Institute) in 1996. He managed hedged equity and alternative (non-correlated) investment accounts for clients from 1992-2005.