Market Review; Seasonally Adjusted Numbers; Gold as an
Inflation Hedge
By Victor
Sperandeo with the Curmudgeon
Stock Market Comments:
The intermediate trend (bear market correction) rally
from the end of September till the 2nd of February may have run its course. U.S. stocks pulled back sharply on Friday,
notching their worst weekly performance of the year, as reported hot economic
data rekindled worries that a more restrictive Federal Reserve policy will
persist. It seems the Fed is hell bent on driving stocks down (to produce a
reverse wealth effect) and are now talking 5.5%+ Fed Funds rate.
The S& P 500 fell 42.28 points, or 1.1%, to
3970.04. The Nasdaq Composite dropped 195.46 points, or 1.7%, to 11394.94. The
blue-chip Dow Jones Industrial Average shed 336.99 points, or 1%, at 32,816.92.
The three indexes all dropped more than 2% in the holiday-shortened week, each
posting their biggest weekly declines of 2023.
“The market is re-calibrating and acknowledging that
the path toward price stability is fraught with obstacles,” said Quincy Krosby,
chief global strategist for LPL Financial. “The market is telling us to
be careful, with a Fed that has to vanquish inflation and hurt the economy to
do it.”
I believe stocks are still in a bear market
based on Dow Theory and the direction and slope of the 200-trading
day moving average of key stock market indexes.
When the recession becomes obvious and reported jobs
start to decline along with earnings, the impact on the equity markets will be
more pronounced. I expect 3,200 on the S&P 500 before any meaningful rally.
As previously stated, I believe the U.S. has been in
a recession since January 2022 or going into recession soon. The NBER,
who are the official classifiers of recession start/end dates has not spoken
yet and will likely do so well after the fact.
Review of Other Markets:
Precious Metals have
made their lows. Gold and the 2x more volatile Silver have sold
off recently due to the stronger than expected economic data which imply higher
interest rates. Gold as a long-term inflation hedge is discussed later in this
article.
………………………………………………………………………………………..
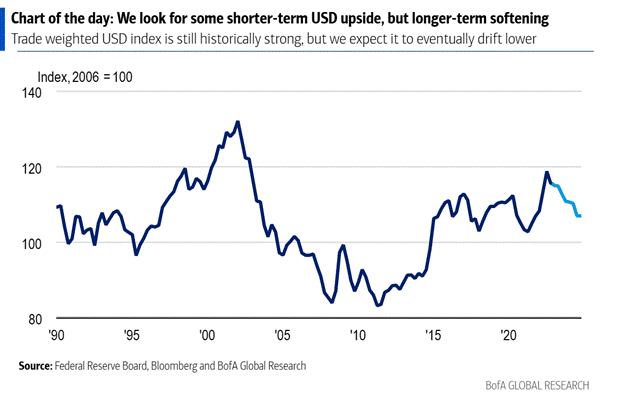
Strong economic numbers have caused a rally in the
U.S. Dollar (USD) this month. The
USD made a low on 2/1/23 and was -2.17% YTD at that time. It’s now +1.85% (YTD) so the USD is now in an
uptrend. BofA Global Research agrees:
“The recent streak of positive economic data and renewed
inflation concerns has pressured U.S. yields higher and lifted the USD off
its 10-month lows. Sticky inflation
implies near-term stability and further upside for USD. That said, any
signs of softening in the labor market or accelerated disinflation could prompt
a reversion to the dollar's downtrend. Investors should expect the USD to be
supported in the near term, followed by moderate depreciation towards the end
of the year.”
Recent higher inflation readings and strong economic data
imply a higher Fed Funds rate (~5.5%) then originally projected. And
those higher rates are expected to persist for a longer period. Fed governor Philip Jefferson said Friday
that he saw greater evidence that the central bank would face a long inflation
battle because strong hiring and wage gains could sustain firmer price
pressures.
“The ongoing imbalance between the supply and demand
for labor, combined with the large share of labor costs in the services sector,
suggests that high inflation may come down only slowly,” he said at a
conference in New York.
-->Fed Funds have a very high inverse correlation
to the U.S. dollar. Higher rates attract
foreign capital to U.S. financial markets.
……………………………………………………………………………………...
Bonds have given
up early 2023 gains, but I believe they’ve made their lows for this cycle. The 10-year Treasury yield started
February at 3.39%. It recently traded at 3.948%, a big jump in a short time.
The iShares Core U.S. Aggregate Bond exchange-traded fund (AGG) was up
3.3% at the end of January, including interest. It’s now up just 0.6%,
relinquishing nearly all its year-to-date gains. The yield on the two-year Treasury note rose
to 4.803% on Friday, the highest since 2007.
Check out this round trip in bond prices this year:
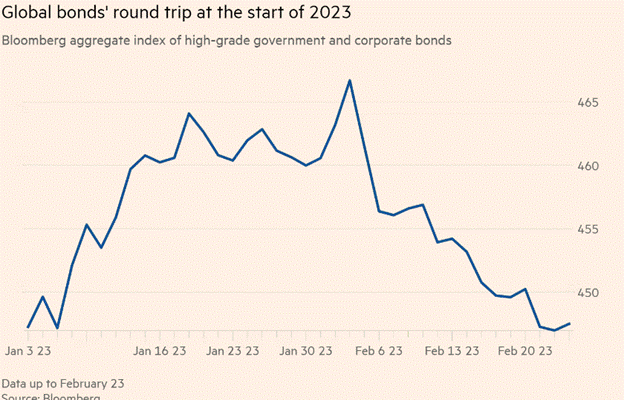
The bond market seems worried that inflation isn’t
cooling nearly fast enough to reach the Fed’s comfort zone at a 2% annualized
rate and rates will therefore have to rise further and longer than expected.
“We’ve had a reality check,” said Michael Metcalfe,
head of macro strategy at State Street, adding that the easing of
monetary policy expected by markets a few weeks ago “looked a little fanciful.”
“Early this year, markets got ahead of themselves in
terms of pricing in Fed cuts, hoping this cycle would end sooner,” said Idanna Appio, a portfolio manager at First Eagle Investment
Management. “Things were priced for perfection — investors were betting
that the Fed was going to get inflation down successfully and quickly. I think
this process is going to take longer than people thought,” she added.
……………………………………………………………………………………...
The CRB Commodity Index is hitting new lows
from 2022 due to a stronger dollar and belief that the recession is imminent
(if not here already). The energy crises
in Europe were averted by a warm winter and the heavy use of Coal for
fuel. That’s resulted in new lows for Natural Gas. The US was charging
an incredible amount for liquefied Natural Gas, so coal is back for now.
…………………………………………………………………………………………...
Beware of “Seasonally Adjusted” Numbers:
We’ve discussed the U.S. government fabrication of
economic numbers many times before, but especially in last week’s column Sperandeo/Curmudgeon:
Finagled U.S. Economic Numbers Explained.
We noted that the huge (fictitious) employment gains (+517,000 Seasonally
Adjusted jobs added in January) should be producing an incredible amount of
tax revenue. Yet the U.S. Treasury Dept
stated that tax revenues decreased by $44 billion or 3%, while the
Congressional Budget Office (CBO) says projects 2023 tax revenues to fall by 2%
to $4.8 trillion.
The CBO now estimates that receipts in January 2023 totaled $448
billion—$17 billion (or 4%) less than the amount recorded in the same month
last year.
So, the disconnect between strong “seasonally adjusted” jobs gains and
declining Treasury tax receipts continues.
Again, whenever you see “Seasonally Adjusted”
government numbers without any context you are being scammed.
Another example is the “Manheim Used Vehicle Value Index” for
wholesale used car prices. It was
reported as +4.1% Seasonally Adjusted for the first 15 days of February which was the largest
February increase since 2009’s full-month 4.4% gain. Yet the non-seasonally adjusted price was
down -5.9% year over year!
Is the Fed looking at Supercore Inflation?
“Supercore inflation” has been in the news lately.
It’s an economic measurement that strips away volatile items from the
traditional Consumer Price Index (CPI), such as food, energy, and housing. It
is an alternative method for tracking inflation and is said by some to provide
a more accurate snapshot of underlying price pressures.
“Supercore inflation was a strong 6.4% on a
year-over-year basis through December 2022, but it is moderating,” said Mark
Zandi, Moody’s chief economist. For the three months through December,
supercore inflation is up only 2.4% annualized, and just 0.9% annualized in the
month of December. Wage growth is also moderating, Zandi said, a good sign for
future supercore inflation.
“The Fed focuses on supercore [1.] because it
includes those prices that are more likely to be driven by the cost of labor,
which the Fed can more directly impact through changes in interest rates,” he
said. “Supercore inflation is still way
too hot, but it has begun to cool off, and all signs point to it and overall
inflation getting back to something more comfortable over the coming 12-18
months,” Zandi told CNN.
Note 1. Neither Fed Chair Jerome
Powell or any other Fed official we know of has said they were using
“supercore” as a gauge to measure inflation.
The Fed’s favorite metric is the core Personal Consumption
Price Expenditures (PCE) index, which excludes food and energy prices. January’s price index released Friday by the Commerce
Department, overshot economists’ expectations. The core reading excluding
food and energy, considered the Fed’s preferred gauge of inflation, rose 4.7%
year on year. That was ahead of consensus forecasts for a 4.4% increase.
Yet with all the buzz about “supercore” inflation, one has to
wonder if the Fed will use that gauge to claim it got inflation down to its 2%
target rate.
Gold as an Inflation Hedge?
Here’s an interesting study on Gold as an
inflation hedge. From January 1914 till the last CPI report in January 2023
(109 years and one month), the CPI has increased 3.14% compounded
annually. Gold has increased 4.17% using June Futures close
Friday from the fixed price of gold of $20.67 in January 1914. That is a
higher return for Gold by 32.8%.
The CPI is not inflation (money supply growth is) and
thereby Gold is not correlated to its rising prices in the short run.
What is Collective Stupidity?
The Fed may not be evil, but just plain
stupid. In that light, kindly consider
this historical analogy:
In 1943, the Lutheran pastor and member of the German
resistance, Dietrich Bonhoeffer, was arrested and
incarcerated in Tegel Prison. There he meditated on the question of why the
German people—in spite of their vast education, culture, and intellectual
achievements—had fallen so far from reason and morality. He concluded
that they, as a people, had been afflicted with collective stupidity.
Bonhoeffer was not being flippant or sarcastic, and
he made it clear that stupidity is not the opposite of native intellect. On the
contrary, the events in Germany between 1933 and 1943 had shown him that
perfectly intelligent people were, under the pressure of political power and
propaganda, rendered stupid—that is, incapable of critical reasoning.
-->Could that type of stupid group think be
prevalent among FOMC members who continue to make hawkish comments to take down
the markets?
End of a Sad Story:
After a failed July 20, 1944, coup attempt in
Germany, Bonhoeffer connections to the broader resistance circles were
uncovered and he was moved to the Gestapo prison in Berlin. In February 1945,
he was taken to Buchenwald and in April moved to the Flossenbürg
concentration camp. On April 9, 1945, he was hanged with other conspirators.
His brother Klaus Bonhoeffer was also executed for resistance activities, as
were his brothers-in-law Hans von Dohnanyi and Rüdiger Schleicher.
Victor’s Closing Comment:
In the U.S. today, the largest corporations use their
money to buy politicians for laws that favor their interests and are against
the people. One must consider if the Constitutional Republic we have in the U.S. is a
failure?
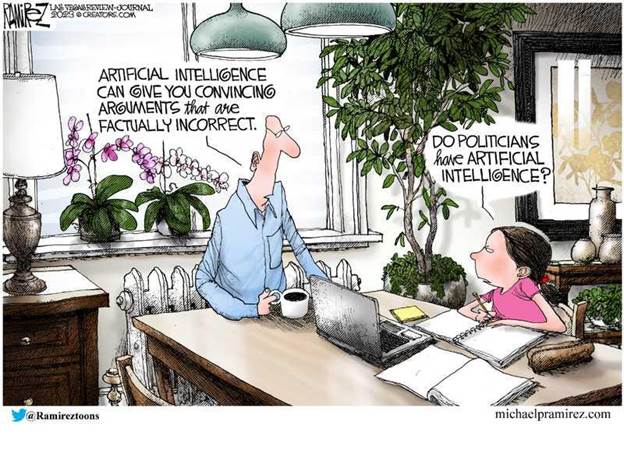
Cartoon of the Week:
………………………………………………………………………………………………
Be well, stay healthy, warm, and dry. Please email
the Curmudgeon (ajwdct@gmail.com)
if you have any comments, questions, or concerns. Till next time…...
The Curmudgeon
ajwdct@gmail.com
Follow the Curmudgeon on Twitter @ajwdct247
Curmudgeon is a retired investment professional. He has been involved in financial markets since 1968 (yes, he cut his teeth on the 1968-1974 bear market), became an SEC Registered Investment Advisor in 1995, and received the Chartered Financial Analyst designation from AIMR (now CFA Institute) in 1996. He managed hedged equity and alternative (non-correlated) investment accounts for clients from 1992-2005.
Victor Sperandeo is a historian, economist and financial innovator who has re-invented himself and the companies he's owned (since 1971) to profit in the ever changing and arcane world of markets, economies, and government policies. Victor started his Wall Street career in 1966 and began trading for a living in 1968. As President and CEO of Alpha Financial Technologies LLC, Sperandeo oversees the firm's research and development platform, which is used to create innovative solutions for different futures markets, risk parameters and other factors.
Copyright © 2023 by the Curmudgeon and Marc Sexton. All rights reserved.
Readers are PROHIBITED from duplicating, copying, or reproducing article(s) written by The Curmudgeon and Victor Sperandeo without providing the URL of the original posted article(s).