Perspective
on U.S. Inflation; 97 Year Analysis of the Fed and Asset Price Declines
By Victor
Sperandeo with the Curmudgeon
Introduction:
In our goodbye/good riddance to 2022 column, we take
a historical look at U.S. inflation and review how this year’s asset class
price declines compare to history.
We find that besides 2022, there were only two other
years where all asset prices dropped. In
1969 (like 2022) it was due to the Fed’s attempt to curb rising prices. A sidebar on 1931 notes that year’s all asset
price declines were primarily due to faulty fiscal policies.
-->Please see our tagline year-end wishes for
readers at the very end of this post.
Historical Comparison of U.S. Inflation:
While this past year’s inflation rate has been well
above the Fed’s 2% target, it’s recently been on a downward trajectory. The annual CPI in the U.S. slowed for a fifth
straight month to 7.1% in November of 2022, the lowest since December last year,
and below forecasts of 7.3% price increases.
Let’s compare inflation in 2022 with past time
periods starting with WW II.
We observe that high rates of U.S. inflation resulted
from wars and energy shocks/policies.
Here are a few examples of the CPI annual rate increases during such time periods:
·
WW II and thereafter: 1941=9.93%,
1942=9.03%, 1946=18.13%, 1950=5.93% 1951=6.00%
·
Vietnam War/ Energy
Shock: 1965=1.6%, 1966=3% 1967=2.8%, 1968=4.3%, 1969=5.5%,
1970=5.8%, 1971=4.3%, 1972=3.3%, 1973 (start of Arab oil embargo was Oct 1973)
=6.2%, 1974=11.1%.
·
Compounded annual rate from
1965-to-1969 =3.86% vs 6.60% from 1970-to-1974 (height of Vietnam War + Arab
Oil Embargo effects).
·
Oil Policy & Big
Budget Deficits: 1977=6.5%, 1978=7.6%,
1979=11.3%, 1980=13.5%, 1981=10.3%.
·
Compounded annual rate from
1977-to-1981=10.06%.
More recently, the primary cause of inflation has
been U.S. federal government spending [1.], that resulted in
extraordinarily huge budget deficits which were monetized by the Fed (via
numerous rounds of QE from Sept 2008 through March 2023).
Note 1. As an
example of excessive and out of control U.S. government spending, consider the $1.7 Trillion Omnibus Spending Bill that
just passed the House and Senate. In total, the regular 12 appropriations bills
include $800 billion in non-defense funding, a $68 billion—9.3% over last year.
This is the highest level for non-defense funding ever and a larger increase
in both dollar and percentage than fiscal year 2022. The bills also provide
$858 billion in defense funding.
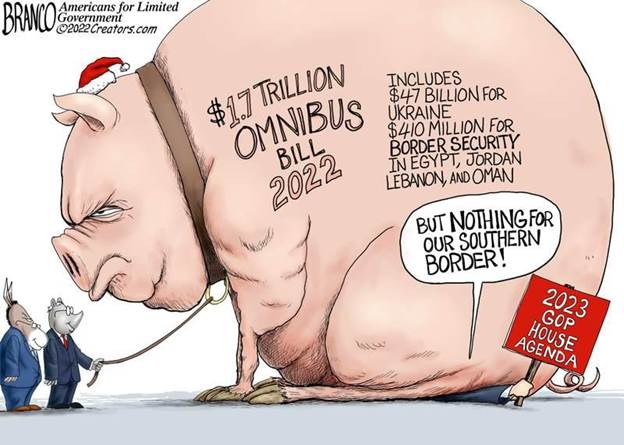
No one knows what the new “earmarks” are contained in it, but
it appears that “earmark” totals more than 7,500 giveaways.
-->That bill will surely lead to future price
increases.……………………………………………………………………………………..
Comment and Analysis:
In 1982, the Debt to GDP Ratio was 34%. In fiscal year 2023, the U.S. government will
spend $16.7 BILLION A DAY FOR 365 DAYS!
That will put the Debt to GDP Ratio at 130%.
Raising interest rates will do little to stop
inflation as rising prices are caused by increases in the money supply. What
was meant by “slaying the inflation dragon” is in reality a bait and switch
ruse from printing money to borrowing it.
The U.S. borrows money by selling U.S. government
securities that result from humongous budget deficits which are financed at
U.S. Treasury debt auctions.
The countries that currently own the most U.S. debt
securities are Japan $1,234.3B, China $970B, United Kingdom $634.6B, and
Luxembourg $304.2B. As those nations are
unwilling to buy more U.S. debt, it seems that the U.S. will be “printing”
money always and forever more?
99% of inflation is caused by UNLIMITED government
spending that is funded by “printing money” which balloons the money
supply. Yes, shortages can occur, but
they are usually created by economic Keynesian inflation policies… e.g.,
Biden’s green energy policy today and Nixon’s price controls and taking the
U.S. off the gold standard in August 1971.
The U.S. government propaganda machine has done a
masterful job in making the public believe RISING PRICES (rather than
increasing the money supply) is what inflation is all about.
Any economist studying the subject knows that price
increases are the direct result of increasing the money supply above the
rate at which goods and services are produced. The Fed and U.S. government
officials helped in creating ignorance among “the people” by their lack of
education (please refer to End Quote below).
In my opinion, only two people ever discuss the
honest truth on the subject of inflation on public TV. They are Prof.
Steve Hanke of the Cato Institute and economist Peter Schiff.
The Fed and Asset Class Price Declines:
“I have in my 30 years as an economist, strategist
and portfolio manager NEVER seen any monetary tightening like this.” Mikael
Sarwe via Twitter
In a misguided attempt to slow inflation since March 2022,
the Fed has been trying to cause a decline in asset prices to stop people from
spending (aka a “reverse wealth effect”).
That could cause a severe recession accompanied by sky high unemployment
numbers. This is criminal in my view,
as most workers earning a living do not cause inflation!
Using Ibbotson Research data back to their
beginning 1926 or now 97 years ago (including this year), there were only two
years where the Fed’s response to rising prices was to drive ALL ASSET prices
down. Those were 1969 and this year
(2022).
The Fed began to raise rates in 1969 due to rising
prices from the “printing of money” from the “Great Society Programs” and the
Vietnam War (aka “Guns and Butter”). The
asset price declines were as follows:
S&P 500 -8.5%, long term U.S. Bonds -5.07%, and U.S. intermediate
Notes -0.74%. T-Bills yielded 6.58%.
Gold did not trade in the U.S., but in the UK it was down -5.75% (SOURCE:
Historical Gold Prices from the Only Gold web site.
As of the 12/23/2022 close, with four trading days
left in this year, the S&P 500 total return is -19.84%, U.S. Long
Bonds (using the TLT ETF) -31.06%, U.S. Intermediate Notes (using
the iShares IEI ETF with 3-7 Year maturities) -10.12%, REITs (using the
IYR ETF) -25.18%, Gold (using the GLD ETF) -2.21%, and Silver
(using the SLV ETF) +1.58%.
My call is for Silver to have a big year in 2023 as
explained in this recent Sperandeo/Curmudgeon blog post.
………………………………………………………………………………………………
Sidebar: 1931 and the Great Depression:
Note that while all asset classes were down in 1931 (during
the great depression), that was primarily due to fiscal policy. In 1931 the
money supply declined 20%, due to the largest increase in tax rates in American
history (from the highest marginal rate in 1929 of 25% to 63% in 1931), and the
Smoot Hawley Tariff Act passed in 1929 (which became effective in effective
March 13, 1930).
In 1931: the S&P declined -43.34%, bonds and intermediate
notes fell by -5.31% and -2.32%, respectively.
The CPI declined from 1930 to 1932 as a result of the 20% decrease in
the money supply.
……………………………………………………………………………………………
Conclusions:
So how deep was the Fed’s boot on the neck of the
markets in 2022? And the harm that did
to the American People in its fool hardy attempts at slowing inflation?
In 2022 the Fed Funds rate went from 0-.25% to
4.25-4.50%% or +1700%!!! If you
annualized the 2022 Fed Funds increase it is 5,100%, according to Mike Maloney
in Silver & Gold Reports.
Compare that to the period from 12/1/68 to 12/1/69
(all assets declined) when the Fed Funds Rate went from 6.02% to 8.97% +2.95%
or an increase of 49% in its rate of change.
Note the highest nominal increase in the Fed Funds
Rates was from 12/1/79 to 12/1/80 at 5.12%, but that was only 37.12%!
While 2022 was not an economically terrible year, the
declines in asset prices have been deep and across the board. The 97 year
history of the markets shows this year was one of three worst overall, where
almost all asset classes declined in price.
End Quotes:
“It isn't so much that liberals are ignorant. It's
just that they know so many things that aren't so.” Ronald Reagan
“Today, this old problem of citizen ignorance and its
political role has been worsened by the expansion of the scale and scope of the
federal government and its agencies over the last 75 years. Indeed, the complexity
of the policies that federal agencies enforce and manage has made Wilson’s
ideas about the necessity for government by technocratic elites a
self-fulfilling prophecy.” Bruce Thornton
……………………………………………………………………………………
Happy New Year, stay healthy, happy, and warm. Till
next time (in 2023) ...
The Curmudgeon
ajwdct@gmail.com
Follow the Curmudgeon on Twitter @ajwdct247
Curmudgeon is a retired investment professional. He has been involved in financial markets since 1968 (yes, he cut his teeth on the 1968-1974 bear market), became an SEC Registered Investment Advisor in 1995, and received the Chartered Financial Analyst designation from AIMR (now CFA Institute) in 1996. He managed hedged equity and alternative (non-correlated) investment accounts for clients from 1992-2005.
Victor Sperandeo is a historian, economist and financial innovator who has re-invented himself and the companies he's owned (since 1971) to profit in the ever changing and arcane world of markets, economies, and government policies. Victor started his Wall Street career in 1966 and began trading for a living in 1968. As President and CEO of Alpha Financial Technologies LLC, Sperandeo oversees the firm's research and development platform, which is used to create innovative solutions for different futures markets, risk parameters and other factors.
Copyright © 2022 by the Curmudgeon and Marc Sexton. All rights reserved.
Readers are PROHIBITED from duplicating, copying, or reproducing article(s) written by The Curmudgeon and Victor Sperandeo without providing the URL of the original posted article(s).