Global Liquidity Supernova; Oil Price Rise vs.
Equities, VIX, Inflation Persists
By the
Curmudgeon with Victor Sperandeo
Introduction:
Lots of keen insights from BoA Research this week.
Also, disconnect between rising stock prices and slower growth economy;
contrarian investing, VIX at 18 month low, Paul Tudor Jones and Victor on
inflation. Much more...
BoA Global Research: 1,000 rate cuts since Lehman Bankruptcy:
Turkey's interest rate cut this week marks the 1000th central
bank rate cut since Lehman bankruptcy (Sept 2008) …That's 1 rate cut every 3
trading days since 2008. It’s a liquidity
supernova ($23tn of central bank asset purchases – see Chart below).
It all ends next year.
Central Bank Asset Purchases from 2006:
Source: BoA Global Investment Strategy, Bloomberg
Oil
Price Increase is a Headwind for Stocks:
WTI
oil has risen 73% this year to >$80/bbl, a 7-year high, and BoA
commodities team expects Brent to clear $100/bbl if we get a cold winter.
Higher oil prices used to be a positive for earnings - every 10% rise in oil
translated into a 5% increase to S&P 500 EPS. Higher oil not only helped
oil producers, but also led to increased capex, benefitting Oil Services,
Industrials, and their derivatives (jobs growth, etc.). But it is different this time! Today's
spike in energy prices represents a headwind, not a tailwind for equities.
Here's why:
1)
Shrinking size of energy beneficiaries: Last time oil was above $100/bbl was
during 2011-14. Back then, oil beneficiaries (Energy, select Industrials,
Chemicals) represented 20%+ of total S&P 500 earnings. Today, that number
is just 6%.
2)
U.S. E&Ps' capital discipline: The rig count remains >50% below the
prior peak. At $80/bbl oil, our Oil Services analysts expect +22% in 2022
E&P capex, but 23% below 2018 levels. This translates to less revenue
for energy capex beneficiaries and a lower earnings multiplier from higher oil.
Energy earnings will also be driven mostly by higher prices, rather than price
+ volume.
3)
Shale industry has matured: During the shale revolution, Oil & Gas capex
represented ~6% of total private capex in the US, and Oil & Gas
construction drove >1/3 of total private non-residential construction, with
significant investments on pipelines, refineries, LNG terminals, etc. But that
infrastructure has now been built.
4)
Supply-led oil rally = negative: Narrowing crack spreads and rising oil prices
suggest a supply-driven oil spike. Historically, supply-led oil spikes have had
an inverse relationship with the S&P 500 (-27% corr.) vs. Demand-led
(+29%).
5)
ESG (Environmental Social Governance): Energy has been starved of capital amid
the rise of ESG investing: High Scope 1 emissions make it hard to own, and all
regional ESG funds are most underweight Energy (see ESG note on Energy). Less
capital means less capex, and ESG investor demands further complicate the capex
decision making process, leading to more selective capex, less supply, and less
revenue for energy capex beneficiaries.
Higher
oil prices mainly driven by supply (as proxied by narrowing crack
spread) have had negative impacts on the S&P 500 (-27% correlation),
whereas high oil prices mainly driven by demand (as proxied by widening crack
spread) have had positive impacts on the S&P 500 (+29% correlation). The
crack spread has narrowed by 2.2% over the past two quarters, indicating that
the recent rally in oil prices has been more supply driven. Thus, a further
rally in oil will likely be a headwind for the S&P 500.
Supply-driven
oil spike = Headwind for S&P 500
The
chart below shows the correlation between S&P 500 Quarter over Quarter
(QoQ) return and WTI QoQ price change when higher oil prices are led by supply
(narrowing crack spread) vs. demand (widening crack spread), March 1986 to
September 2021. When higher oil prices
were due to supply shortages, the S&P declined 27%. When increased demand drove oil prices
higher, the S&P increased 29%.
Victor argues below that supply of oil and gas is being curtailed by the
Biden administration’s Clean Energy policies.
Do you think this year’s oil price increase was due to supply or demand?

Source:
U.S. Energy Information Administration FactSet, BofA US Equity & Quant
Strategy
..............................................................................................................
The
Tale of the Tape: liquidity at record high, bitcoin at record
high, stocks (S&P 500, DJI) at record high, labor market quits rate at
record high, consumer confidence down (see Chart below), wage growth
plans at record high, bond allocations at record lows for institutions (net
-80% in BofA FMS), for private client (17.5% at BofA GWIM), and for US
households (19% - lowest since 1984).
Scores on the Doors: YTD bitcoin up 122.9%, oil
72.9%, commodities 52.8%, stocks 16.7%, US$ 4.0%, HY bonds 1.7%, cash 0.0%, IG
bonds -2.8%, gold -5.9%, government bonds -6.4%.
Not all fourth quarters are
bullish for stocks as per this table:
The negative SPX Q4's since
1978. Normally associated with credit
wobbles:
............................................................................................................................
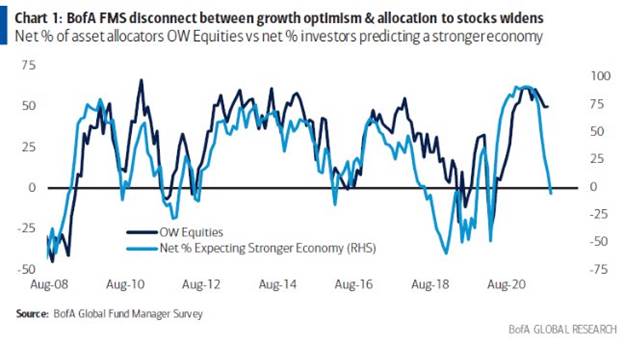
Latest fund manager survey
from @BankofAmerica shows massive disconnect between investors’ allocation to stocks (dark blue)
and expectations of stronger economy (light blue) … economic optimism has
fallen sharply while equities are still mostly loved.
........................................................................................................................
FT - Against the herd: trader Mark Spitznagel on contrarian
investing
“It’s a terrible
time for equity investing. It’s the worst time for this generation,” says
Mark Spitznagel. “It’s very, very similar” to 2007, he says, although credit
spreads and equity and bond valuations “are far more stretched today; NFTs
[non-fungible tokens for digital assets] would have been laughed away in 2007.”
Much of the
blame, he says, can be heaped squarely on central banks, which “are acting like
it’s an emergency, despite [asset] valuations.” Spitznagel points to the rescue
in the late 1980s of Continental Illinois National Bank, which he says was the
start of the “too big to fail” policy. The idea that the Fed would provide a
backstop against crises “let more and more irresponsibility happen. Investing
is no longer about having to think about systemic risks in that way.”
Mark is careful not to say
when a crash might happen but insists there must come a time “when you can’t
take on more debt”. He adds: “It’s a very strong view I have. What has happened
in the past decades is... laying the groundwork for the next
crash.”
.............................................................................................................................
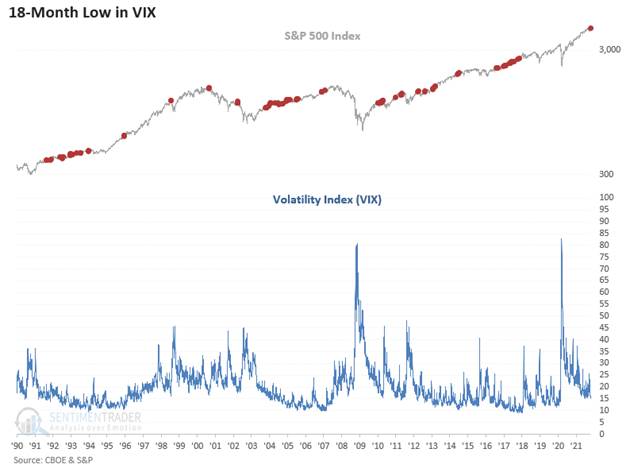
Sentiment Trader - VIX at New
Low:
The Volatility Index (VIX)
closed at a new 18-month low as the S&P 500 closed at a new multi-year high
on Thursday, October 21st. The 18-month low in the VIX Index represents the
first occurrence since November 2017. Of
course, low volatility indicates extreme complacency, i.e., risk is a thing of
the past?
Paul Tudor Jones says inflation could be worse than feared:
“I think to me the No. 1 issue facing Main Street investors
is inflation, and it’s pretty clear to me that inflation is not transitory,”
Jones said Wednesday on CNBC’s “Squawk Box.” “It’s probably the single
biggest threat to certainly financial markets and I think to society just in general.”
Jones said the trillions of dollars in fiscal and monetary
stimulus is the impetus for inflation to run hotter for longer. To rescue the
economy from the Covid-19 pandemic, the Federal Reserve has added more than $4
trillion to its balance sheet through its open-ended quantitative easing
program, while the U.S. government has unleashed over $5 trillion in fiscal
stimulus.
“Inflation can be much worse than what we fear. We
have the demand side of the equation ... and that is $3.5 trillion greater than
what it normally would have ... just sitting in liquid deposits,” Jones said.
“They can go into stocks, or crypto, or real state, or be consumed, so that’s a
huge amount of dry powder just sitting waiting to be utilized at some point,
which is why inflation is not going away.”
“You don’t want to own fixed income,” Jones said. “You do not
want to hold that whatsoever because what they’re saying, what they’re telling
you by their actions, is that they’re going to be slow and late to fight
inflation and somewhere down the road, somebody will have to come in ... and
put the hammer down.”
Victor on Inflation:
If U.S. federal government spending/ $T+ budget deficits and Fed
debt monetization continues, it’s safe to assume that there will be further
(high) price increases. That’s because “Inflation
is always and everywhere a monetary phenomenon,” as per Milton Freedman and
numerous Fed rounds of QE has caused stupendous increases in money (e.g., bank
reserves, monetary base, M1, and M2).
Therefore, inflation
will NOT be “transitory,” as long as the U.S. creates large budget deficits
financed mostly by the Fed. Let’s look
at the evidence:
- Fiscal year ending
2021 had a stated deficit of $2.77 trillion second highest in history only
to the 2020 deficit of $3.1 trillion.
- From Dec 1982 to
Dec 2018, M1 had a compounded increase of 6.12%. But from the end of 2018 to September
2021 M1 went from $3.998 T to $19.857 T for a compounded annual rate of
increase of 77.3%!
In other words, the huge Fed stimulated increase in the money
supply (INFLATION) over the last few years caused retail prices to dramatically
increase. Contrast that to the period
before 2018 where more normal money supply increases caused much lower price
increases of 1.54% from 2011-2018 (using CPI headline non-seasonally adjusted
calculations).
We see that U.S. government spending, funded by printed money
(Fed QE “keystroke entries”), causes more money to circulate. Therefore, food and gas prices go up as does
everything else. In my opinion, these prices increases have little to do with
supply chain shortages or the demand for goods and services.
……………………………………………………………………………………………………………………………….
Victor’s
Conclusions:
The Fed has
done a masterful propaganda job to deflect the truth: that inflation is
actually a monetary phenomenon caused by the creation of more money (aka QE or
“keystroke entries”). While supply chain shortages may contribute to rising
prices of finished goods, it is not the root cause of inflation.
If the U.S.
government continues to spend money, well beyond the collection of taxes, then
the resulting price increases will NOT BE TRANSITORY! This is the reality of correctly defining
what you’re talking about (e.g., that inflation is a monetary phenomenon via
the creation of new money). Prices of
everything are going up, just at different rates of increase.
Specifically,
energy prices will continue to rise due to the U.S. government’s policy
to curtail (so called) climate change. That will cause lower supplies of oil
and gas, which will add to price increases as virtually everything is made and
distributed using fossil fuels.
As we noted
in last week’s Curmudgeon blog post, green energy (wind, hydro,
and solar energy) only accounts for about 20% of electricity generation and a
smaller percentage for the production and distribution of goods and services.
Lastly, it
should be noted that the highest U.S. Treasury yields for this year were
reached on October 21st: 5-year T note=1.23% vs 0.36 on 12/31/20; 10-year T
note=2.13% vs 0.92% 12/31/20. That might
be due to Fed Chairman Powell’s speech the next day where he said that it is
difficult to predict when the ongoing supply-chain issues will ease. As a
result, Powell could see the case for inflation remaining high for a longer
period of time. Please refer to: Equities Sell Off as Fed Chair Powell Sees High Inflation
Lasting Into 2022.
Prices rises
can’t be ignored and will sooner or later put pressure on politicians and the
Fed to be more disciplined in their respective fiscal and monetary policies.
End Quote:
Money
printing is about redistribution - "Everyone wants to live at the expense
of the state. They forget that the state lives at the expense of
everyone."

Frederick Bastiat was a French economist, writer, and a prominent member of
the French Liberal School.
Stay healthy, enjoy life,
success, good luck and till next time….
The Curmudgeon
ajwdct@gmail.com
Follow
the Curmudgeon on Twitter @ajwdct247
Curmudgeon is a retired investment professional. He has
been involved in financial markets since 1968 (yes, he cut his teeth on the
1968-1974 bear market), became an SEC Registered Investment Advisor in 1995,
and received the Chartered Financial Analyst designation from AIMR (now CFA
Institute) in 1996. He managed hedged equity and alternative
(non-correlated) investment accounts for clients from 1992-2005.
Victor
Sperandeo is a historian, economist and financial innovator who
has re-invented himself and the companies he's owned (since 1971) to profit in
the ever changing and arcane world of markets, economies and government
policies. Victor started his Wall Street
career in 1966 and began trading for a living in 1968. As President and CEO of
Alpha Financial Technologies LLC, Sperandeo oversees the firm's research and
development platform, which is used to create innovative solutions for
different futures markets, risk parameters and other factors.
Copyright © 2021 by the Curmudgeon and
Marc Sexton. All rights reserved.
Readers are PROHIBITED from
duplicating, copying, or reproducing article(s) written
by The Curmudgeon and Victor Sperandeo without providing the URL of the
original posted article(s).