Down to Their Last Pennies – Investor Market Exposure
Unprecedented
By the
Curmudgeon with Victor Sperandeo
Introduction:
Once again, we bring you the best from financial and economic
experts via their commentaries and charts.
Victor’s thoughts on energy and the Green New Deal make for provocative
reading, especially in light of President Biden’s $3+
trillion (budget busting) spending plan. We hope you find the educational
content provided to be informative and useful.
Enjoy!
WSJ: How the Fed Finances U.S. Debt:
In the past two years alone, the Fed acquired more than $3.3
trillion of Treasury debt—which equates to more than half of the combined
federal budget deficits for 2020 and 2021.
Moreover, the Fed takes the interest payments received on its portfolio
holdings of Treasury securities and other U.S. government-backed securities and
sends the vast bulk of that income as revenues to Treasury. The Fed’s
“remittances” to Treasury totaled $87 billion in 2020—some 85% of the Fed’s
$102 billion annual interest income. Remittances to Treasury are running even
higher this year, based on the Fed’s June 2021 quarterly report, and will
likely exceed $100 billion. How’s that for a gimmick?
Reference: Is
the Fed a No Risk Hedge Fund or a Ponzi Scheme?
With the Fed owning roughly one-quarter of the federal debt held by the
public on which the Treasury must pay interest—and with the Fed’s practice of
sending weekly remittances to Treasury—it’s clear that monetary and fiscal
policy are conflated.
So, it rings a bit hollow for Ms. Yellen to intone about the
dangers of compromising the independence of the Fed. And it also seems
disingenuous to conflate the requirement to make interest and principal
payments on U.S. government debt with some larger notion about “paying
America’s bills.”
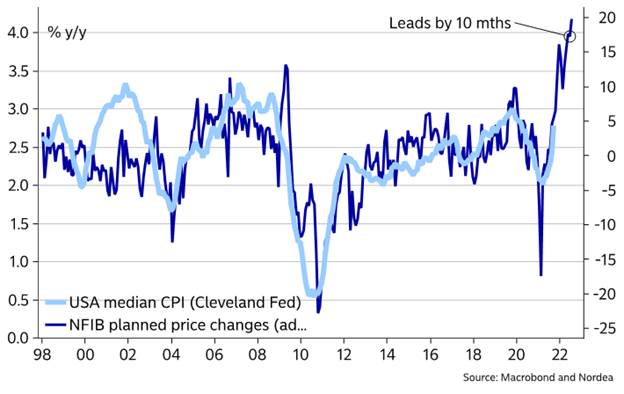
Tweet by Mikael Sarwe of Nordea Bank on Inflation Broadening:
The Fed has been looking for broadening inflation. Well, now
they have it. Median CPI jumped a
massive 0.5% m/m, and the three-month rate is the highest since 1991. Small businesses moreover indicate that this
is only the beginning (see second chart below).
We cannot remember a week when there was so much evidence
that our longstanding “anti-transitory” US inflation view is correct. We are not totally sure how the Fed will
interpret the recent inflation numbers. There should be a clear indication
of the Fed needing to turn more hawkish or even start thinking about rate hikes,
but we suspect it will take yet another few numbers before that rhetoric takes
hold amongst most Fed governors.
US inflation is broadening quickly:
More from Nordea’s website:
Heading into the Q3 earnings season it’s unclear
whether companies have guided down profit expectations sufficiently. They
usually have, but Q3 was a difficult period due to component shortages and
generally rising costs. However, we think this is still more of a 2022 story.
US small businesses (via NFIB)
indicate a more negative profit outlook:
Corroborating Inflation Tweet from Michael Ashton:
Transitory is dead. There is too
much liquidity. The Fed now needs to choose whether to drain liquidity (not just
taper), and live with much lower asset prices, or keep pumping asset prices
"for the rich," while we all ultimately lose in real purchasing
power.
…………………………………………………………………………………………………………………….
B of A Global Research – Earnings Estimates (via email):
Earnings estimates have risen
3% into 3Q earnings season despite supply chain issues, the impact of the delta
variant, wage inflation and the tendency for estimates to fall into the
quarter. Consensus estimates suggest the 2Y growth rate will be just 16% in 3Q,
a slowdown from 2Q’s 27% when profit margins were at record levels.
In 3Q, supply chain news stories increased 74% with freight
rates from China up 20% and record backlogs at the ports. It’s rare for
earnings to miss but B of A’s head of U.S. market strategy Savita
Subramanian expects earnings to be just in-line with consensus and for
investors’ main focus to be on guidance for next year.
Given aggressive cost inflation, Savita suspects 2022 EPS will be revised
lower, and with the Street expecting record margins next year there are
risks to consensus estimates.
Near-record proportion of profit warnings: Several companies have recently issued negative
pre-announcements, mostly concentrated in Consumer, Materials, and Industrials
amid supply chain issues. 3Q21 had the third highest number of "profit
warnings" story counts on Bloomberg, only after 4Q15 and 1Q19. In those
quarters, earnings beat consensus by 0.6% and 4.9%, respectively, but
subsequent quarter earnings were revised down by 9.3% and 2.2%.
3Q21 had the third highest number of "profit
warnings" story counts. Bloomberg story counts on "profit
warnings" (4Q2011-3Q2021):
The market crash is coming – here’s what to do about
it, Tom Stevenson:
The list of things to worry about has got considerably
longer since the spring – inflation, broken supply chains, rising energy costs,
an imminent turn in the interest rate cycle, high-ish valuations, stretched
profit margins, slowing earnings growth. I could go on….
If you look at the performance of the S&P 500 in the
three years following each of the major bear market bottoms over the past 60
years, there has been a pull-back of at least 10pc at least once. We are now a
year and half on from the COVID (market) bottom and we are yet to experience a
double-digit decline.
For most of us, without a lifetime of investing still
stretching ahead of us, there is merit in Warren Buffett’s “rule number one” -
don’t lose money.
Oct 2021 Elliott Wave Financial Forecast (subscription
required) - Cash is Trash:
When it comes to cash, the ultimate safety net,
investors have never been stretched as thin as they are now. At 2.02 %,
for instance, the 10-month average of cash-to-assets held by mutual fund
managers is—incredibly—less than half of what it was at the end of the dot.com
mania in 2000. Second line in graph
below is mutual fund cash to assets ratio.
[According to the latest Investment Company Institute monthly report,
the liquidity ratio of equity funds (the percentage of liquid assets
over total net assets) was 2.0 percent at the end of August 2021, unchanged from
July.]
The third graph on the below chart shows the Investment
Company Institute’s ratio of cash in money market funds as a percentage of
S&P market capitalization (the Retail Money Market Ratio). The latest
reading of 2% is the lowest in the 41-year history of the data.
According to Rydex’s mutual fund data, a historic
disdain for cash continued through much of September. The percentage of total
assets invested in money market funds as a percentage of total assets in
bullish index and sector funds fell to a record low of 0.06% and held there for
13 trading days between September 1st and September 21st.
In January 2020, when the Rydex money market holdings dropped
to 0.10% ten times in one month, EWFF stated, “The bullish imperative is the
most persistent yet.” The next big move for the S&P 500 was a 35%
decline to March 23, 2020. The current situation is even more extreme.
The bottom graph above shows another unprecedented exposure
to equities. The Net Cash Available to Invest figure subtracts liabilities or
margin debt held by investors at New York Stock Exchange member firms from free
credits, which are essentially the same as cash. The biggest net deficits
generally come at stock market highs. The latest figure for August is -$493.3
billion, a record. The deficit is more than 3.7 times that which occurred at
the March 2000 peak.
One of the reasons we (Elliott Wave International)
have emphasized cash levels over the years is that they are a concrete
representation of what investors are (actually) doing as opposed to an
inference or query about how they feel.
GMO - CLASSIC SIGNS OF SPECULATION – “Growth Stocks”
with No Earnings:
More than half of U.S. Growth stocks* have negative earnings,
yet Growth stocks have dramatically outperformed in the past few years.
MAKING MONEY ON COMPANIES THAT MAKE NO MONEY: % of Russell
3000 Growth Stocks with Negative Earnings:
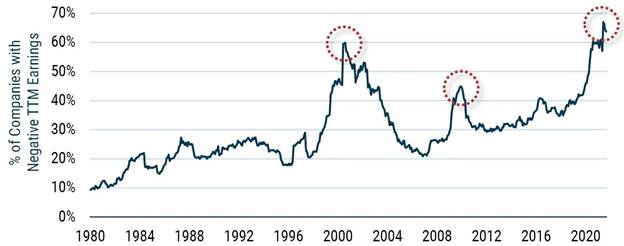
Data through 9/30/2021 | Source: Source: GMO
*The universe and rebalancing methodology are similar to that of the Russell 3000, but the definition of
“Growth” is a proprietary GMO composite of metrics.
……………………………………………………………………………………………………………………………
Classic Signs of Speculation: Every bubble is
unique. The economic environment is unique, the players are unique, the
industries and companies caught up in the frenzy may be unique. All true. But
classic common threads also run through bubbles because they are born of human
nature: the fear of missing out, watching with envy as others get rich around
you, career risk and (for investment professionals) keeping up with peer groups
and benchmarks, the willing suspension of healthy disbelief, and the
dissolution of discipline.
Making Money on Companies That Make No Money: Bidding up the prices of money-losing enterprises is a
classic bubble sign. It has shown its face in the SPAC phenomenon, certainly.
But in the chart above, we see the same phenomenon in established companies.
Today, 60% of the Growth stocks in the Russell 3000 Index make no money, and
this was true even before the COVID-induced recession. Yet these very companies
have been generating huge returns in price movement over the past few years,
dramatically outperforming their Value counterparts. The Russell 3000 Growth
Index was up 84% cumulatively over the last two years through August (more than
double the return of its Value counterpart).
So, investors are making money on companies that make no
money – never a good sign when it is done this pervasively and at these
valuations. And while not common, it is also not unique. We all witnessed the
same speculative behavior in the late 1990s and in the 2008 speculative bubble.
Victor on Energy Consumption, Production and The Green New
Deal:
According to Rob West, founder of Thunder
Said Energy, the world now consumes 63,000 terawatt hours (TWH)
of energy a year [a terawatt (1 x 10¹²) -hour
is a unit of energy equal to one terawatt of power sustained for one hour]. It
is headed to 120.000 terawatt hours in 2050.
How much of future energy consumption might be generated by renewable
energy vs fossil fuels?
U.S. Energy Information Administration
(EIA): In 2020, about 4,009 billion kilowatt-hours (kWh) (or about 4.01
trillion kWh) of electricity were generated at utility-scale electricity
generation facilities in the United States.
About 60% of this electricity generation was from fossil fuels—coal,
natural gas, petroleum, and other gases. About 20% was from nuclear energy, and
about 20% was from renewable energy sources.
The EIA
further states that “the number of countries announcing pledges to
achieve net-zero emissions over the coming decades continues to grow.
But the pledges by governments to date – even if fully achieved – fall well
short of what is required to bring global energy-related carbon dioxide
emissions to net zero by 2050. The
pathway remains narrow and extremely challenging, requiring all
stakeholders—governments, businesses, investors, and citizens—to take action
this year and every year after so that the goal does not slip out of reach.”
I think that zero use of fossil fuels in 30 years is
impossible to achieve. Here’s why:
- Driving motor
vehicles currently uses 14% of the world’s energy in a year. Does
anyone think there will be 100% Electric Vehicles (Ev’s) used worldwide by
2050?
- Mr. West says that
an electric fueled 747 airplane can travel only 90 miles without a
charge. That would require 15 stops
from Dallas (DFW) to NY (JFK) for charging. Would airplane passengers put up
with such delays?
- There are 35
consumption categories that use over 1% of the world’s energy. For
example, cement uses 8%; food for fertilizer uses 13%; and metals 10%. Could those sources convert to 100%
renewal energy in 30 years?
In conclusion, initiatives to greatly reduce the use
of fossil fuels are not likely to succeed.
For example, the Green New Deal [1.] is supposed to drive
CO-2 omissions to zero by 2050. If
that were to happen, expect to live like The Simpson’s in the Stone Age.
Note 1. The Green New Deal is
a U.S. movement to reduce greenhouse gas emissions in order
to avoid the worst consequences of climate change while also trying to
fix societal problems like economic inequality and racial injustice. It is an
integral part of the Biden administration’s $3+ trillion spending proposal. However, the NY Times reports that
“the most powerful part of Biden’s climate agenda — a program to rapidly
replace the nation’s coal- and gas-fired power plants with wind, solar and nuclear
energy — will likely be dropped from the massive budget bill pending in
Congress, according to congressional staffers and lobbyists familiar with the
matter.”
End Quote:
“Inflation and credit expansion, the preferred methods of
present-day government openhandedness, do not add anything to the amount of
resources available. They make some people more prosperous, but only to the
extent that they make others poorer.” Ludwig von Mises from his book Bureaucracy.
Explanation: Creating
money “out of thin air” (QE) drives up the prices of financial assets, real
estate and prices of goods and services in general. Insofar as the owners of real
assets and large businesses are the primary beneficiaries of easy money, their
wealth and incomes will increase much faster than the average worker who
becomes relatively poorer.
.......................................................................................................................
Stay healthy, enjoy life, success, good luck and till next
time….
The Curmudgeon
ajwdct@gmail.com
Follow
the Curmudgeon on Twitter @ajwdct247
Curmudgeon is a retired investment professional. He has
been involved in financial markets since 1968 (yes, he cut his teeth on the
1968-1974 bear market), became an SEC Registered Investment Advisor in 1995,
and received the Chartered Financial Analyst designation from AIMR (now CFA
Institute) in 1996. He managed hedged equity and alternative
(non-correlated) investment accounts for clients from 1992-2005.
Victor
Sperandeo is a historian, economist and financial innovator who
has re-invented himself and the companies he's owned (since 1971) to profit in
the ever changing and arcane world of markets, economies
and government policies. Victor started
his Wall Street career in 1966 and began trading for a living in 1968. As
President and CEO of Alpha Financial Technologies LLC, Sperandeo oversees the
firm's research and development platform, which is used to create innovative
solutions for different futures markets, risk parameters and other factors.
Copyright © 2021 by the Curmudgeon and
Marc Sexton. All rights reserved.
Readers are PROHIBITED from
duplicating, copying, or reproducing article(s) written
by The Curmudgeon and Victor Sperandeo without providing the URL of the original
posted article(s).