Eye Opening Charts and Commentary are a Wake-up Call
for Investors
By the Curmudgeon
Introduction:
Article excerpts and charts this week as selected by the
Curmudgeon. Hopefully, they’ll be a wake-up call or at least a sanity check for
bullish investors and speculators.
Victor’s thought-provoking comments are here.
Please email the Curmudgeon (ajwdct@gmail.com) to express your
interests, opinions, suggestions, comments, or concerns. Have a great week!
Stock, Bond and Real Estate Prices Are All
Uncomfortably High, by Robert Shiller
The prices of stocks, bonds, and real estate, the three major
asset classes in the United States, are all extremely high. In fact, the three
have never been this overpriced simultaneously in modern history.
Clearly, this is a time for investors to be cautious. Beyond
that, it is largely beyond our powers to predict. Consider this trifecta of
high prices:
·
Stocks. Prices in the American market have been elevated for years,
yet despite periodic interruptions, they have kept rising. A valuation measure
that I helped create — the cyclically adjusted price earnings (CAPE) ratio —
today is 37.1, the second highest it has been since my data begin in 1881. The
average CAPE since 1881 is only 17.2. The ratio (defined as the real share
price divided by the 10-year average of real earnings per share) peaked at 44.2
in December 1999, just before the collapse of the millennium stock market boom.
·
Bonds. The 10-year Treasury yield has been on a downtrend for 40
years, hitting a low of 0.52 percent in August 2020. Because bond prices and
yields move in opposite directions, that implies a record high for bond prices
as well. The yield is still low, and prices, on a historical basis, remain
quite high.
·
Real estate. The S&P/CoreLogic/Case-Shiller National Home Price
Index, which I helped develop, rose 17.7 percent, after correcting for
inflation, in the year that ended in July. That’s the highest 12-month increase
since these data begin in 1975. By this measure, real home prices nationally
have gone up 71 percent since February 2012. Prices this high provide a strong
incentive to build more houses — which could be expected eventually to bring
prices down. The price-to-construction cost ratio (using the Engineering News
Record Building Cost Index) is only slightly below the high reached at the peak
of the housing bubble, just before the Great Recession of 2007-9.
There are many popular explanations for these prices, but
none is adequate.
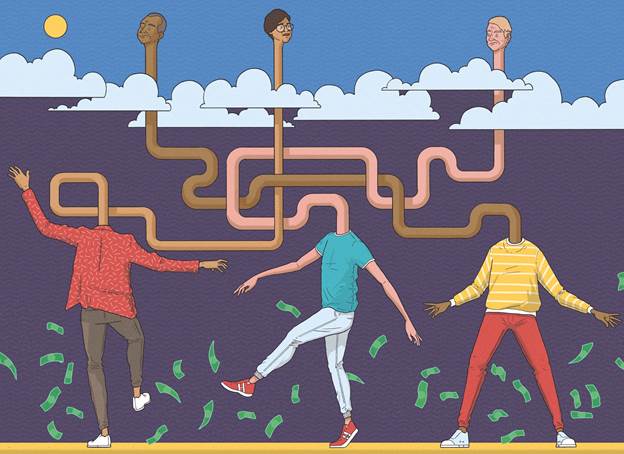
Curmudgeon Suggestion: consider
the illustration below (from the NY Times) as a comprehensive explanation. The three heads shown could be those of the
last three Fed Chairs – Powell, Yellen, and Bernanke.
Timing is important, yet it’s impossible to time the markets reliably. It would
be prudent, under these circumstances, for investors to make sure their
holdings are thoroughly diversified and to focus on less highly valued sectors
within broad asset classes that are already highly priced.
WSJ: Individuals Embrace Options Trading,
Turbocharging Stock Markets
Professional investors have long tracked the options market
for clues on the stock market’s next turn. Now, favored by individual investors
for its small upfront investments and potentially quick payoffs, options
trading is hitting levels never seen before.
At
times, options trading has dwarfed activity in stocks, creating leverage that
traders and analysts say stands to accentuate both up and down moves in the
market.
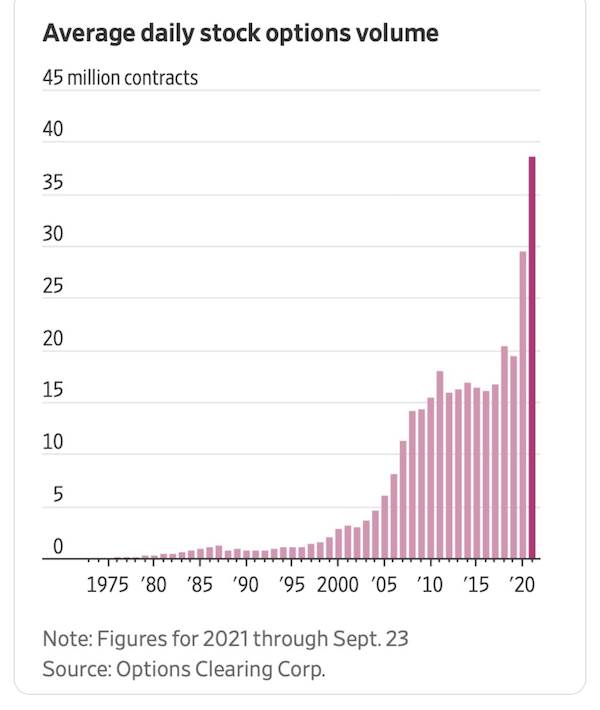
Nine
of 10 of the most-active call-options trading days in history have taken place
in 2021, Cboe Global Markets data show. Almost 39 million option contracts have
changed hands on an average day this year, up 31% from 2020 and the highest
level since the market’s inception in 1973, according to figures from the
Options Clearing Corp. By one measure,
options trading by individual investors has risen roughly fourfold over the
past five years, according to Cboe data.
“I’m
hooked on the options,” said Britt Keeler, a 40-year-old individual investor
based in Winter Park, FL. “You could lose it all really quick but you could
hustle and kinda hit the jackpot. Everyone
is using leverage. And they’re using it because you can make a ton more
money,” he said.
By
one measure, options activity is on track to surpass activity in the stock
market for the first time ever. In 2021, the daily average notional value
of traded single-stock options has exceeded $432 billion, compared with $404
billion of stocks, according to calculations by Cboe’s Henry Schwartz. This
would be the first year on record that the value of options changing hands
surpassed that of stocks, according to Cboe data going back to 2008.
Some
analysts say the zeal for options trading is translating to bigger swings in
individual stocks, and fueling the momentum behind many rallies. When
individual investors buy call options, the Wall Street firms that sell options
often hedge their positions by buying the shares, further contributing to
rising markets.
“It
creates a circular kind of melt up. It’s a reinforcing loop,” said Mr.
Karsan, of options activity in individual stocks. (Curmudgeon: Until the music stops!)
The
activity can also exacerbate downturns, traders say, though for much of the
past year the stock market has recorded a steady climb higher. The heavy
trading has made quarterly dates when options expire a focus point for many
investors, who say hedging activity around the contracts can fuel greater
instability in the stock market.
Short-term
trading using derivatives including options can increase the prospect of a
violent shakeout if individual stocks or major indexes take an abrupt turn,
traders and analysts say.
Bespoke: Charts of the Week
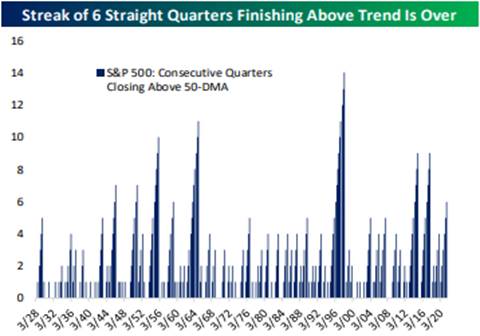
September proved to be a weak month for the broader market
just as it was last year. The drawdown in the S&P 500 snapped a six-quarter
streak of finishes above the 50-day moving average. While six straight quarters
of finishing above the 50-DMA is impressive, as shown in the chart below, it
wasn't close to a record streak.
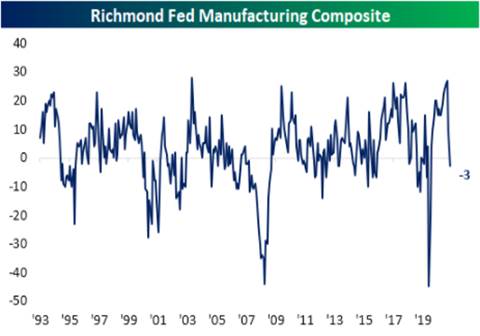
Richmond
Fed Manufacturing Composite turned in its first negative since the early
days of the pandemic. As this reading shows, companies are struggling to
produce the goods needed to meet consumer demand.
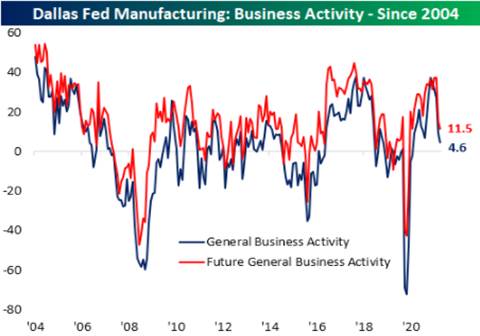
The Dallas Fed reported that its Manufacturing Business Activity
index fell to a level of 4.6. While
still positive and indicative of growth, this month's reading came in below
consensus forecasts.
Demand Is Not the Economy’s Problem. Supply Is, by
Mohamed A. El-Erian
Policy makers and central bankers are stuck in a mindset from
the last crisis and need to alter their thinking.
Cognitive traps (rear-view framing, confirmation bias, blind
spots, etc.) can slow the shift of policy makers’ focus to supply disruptions,
which have become the main cause of the economic malaise of today and tomorrow.
Instead, they reinforce some approaches, particularly in monetary policy, that
inadvertently amplify the stagflation winds that are starting to blow across a
growing number of countries.
Cognitive
biases are particularly problematic at a time of big changes in the operating
environment. This was clear in the aftermath of the 2008 financial crisis with
the overly cyclical economic mindset that delayed policy responses to what
constituted a structural and secular shock several years in the making. We are
seeing it today with one that is evolving too slowly from demand to supply.
Palm Valley Capital Management: Friends in Different
Places, by Eric Cinnamond
The
economy and financial markets could use a break from the Federal Reserve’s
“full-throttle” monetary policies. Stress is building with the economic and
asset price wheels spinning so fast there is a sense that at any moment
something could break. The Federal Reserve, in our opinion, has “QE’d” so hard
and for so long that their policies have become counterproductive.
Meanwhile,
Fed members attempt to justify current policies by claiming there is too much
slack in the labor market and inflation is transitory. The Fed’s views conflict
with some of the most pressing challenges workers and business owners are
experiencing.
Assuming
current trends continue, we expect the transitory inflation narrative will
eventually succumb to reality (persistant inflation) and threaten the Federal
Reserve’s ability to monetize debt and maintain negative real interest rates.
Without the Fed’s intrusive interference in the free markets, interest rates
would once again move freely, allowing asset prices to properly reflect their
underlying fundamentals. Ironically, instead of the Federal Reserve saving us
from inflation, we believe it will be inflation that saves us from the Federal
Reserve.
Tweets by Jurrien Timmer, Director of Global Macro
Research at Fidelity
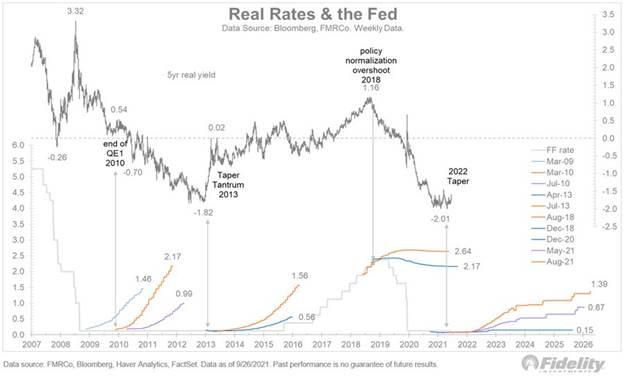
Unless
inflation expectations rise along with nominals, real rates could become less
negative for a while. This chart shows that the 5-year real TIPS yield is about
where it was in the spring of 2013, when we had the original taper tantrum.
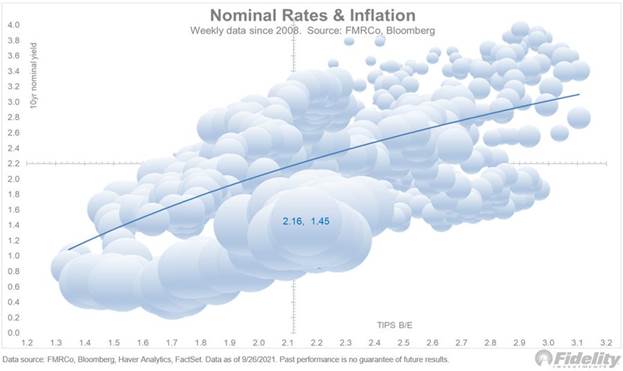
Given
the relationship between Treasury Inflation Protected Securities (TIPS)
break-evens and nominals, it’s possible that the 10-year yield could climb to a
2-handle if the Fed exits the scene. If so, that could cause some more
multiple-compression for equities.
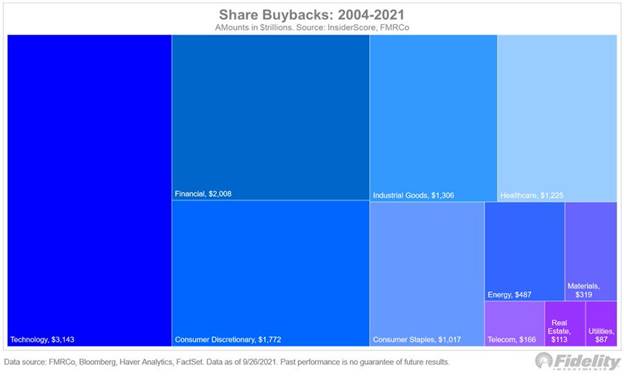
IPOs
and secondary offerings are surging, but share buybacks are strong also.
Over the years, the demand side of companies buying back their shares from
the public has outpaced the supply of companies selling their shares to the
public.
The
chart below shows cumulative share buybacks by sector. Since
2004, US companies have spent $11 trillion on repurchases, or about a fourth of
the market cap of publicly traded US equities. Wow.
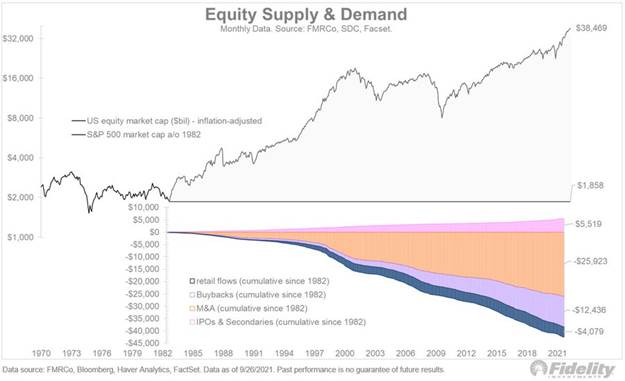
The
chart below shows the cumulative stock supply and demand since 1982. I view the
early 1980s as the start of the modern financial era, so that seems like a good
place to start.
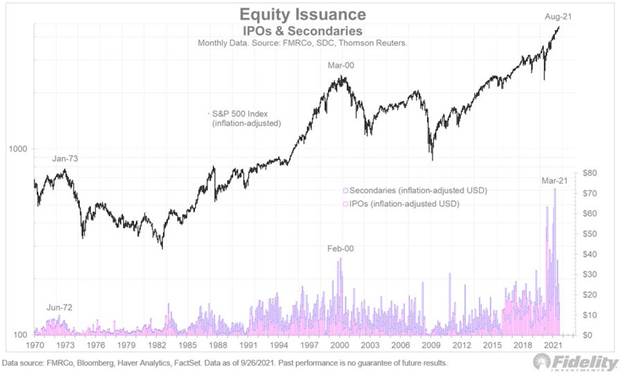
Price
is at the intersection of supply & demand. The chart below shows IPOs
and secondary issuance. With the surge of companies monetizing their value,
it’s tempting to draw parallels to 2000 and conclude that pretty soon the
stock market will be drowning in a sea of supply.
Real Investment Advice, by Lance Roberts
The data shows that nearly 40% of the time, two months of
positive performance gets followed by at least one month of negative
performance. Since 1871, there have only been 12-occurrences of 6-month or
greater stretches of positive returns before a negative month appeared.
For September, the S&P turned in a negative 4.89% return.
While the decline was average for a market correction period, the financial
media made it sound like the market just “crashed.”
If you didn’t like the recent decline, you have too much risk
in your portfolio. We suggest using any rally to the 50-dma next week to reduce
risk and rebalance your portfolio accordingly.
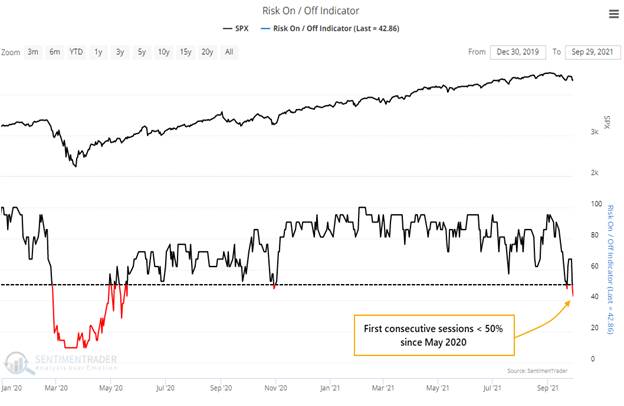
Tweet by Sentiment Trader- Has the tide really turned?
For the past 16 months, buyers came in the very next day
after investor behavior went to risk-off mode……. Until now. This just ended the longest streak of
risk-on behavior in 22 years.
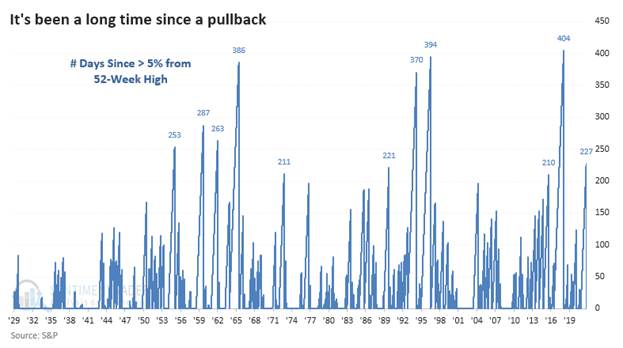
Sentiment Trader: S&P 500 Ends Streak
With
a loss to end the month, the S&P 500 finally ended its streak of 227 days
of being within 5% of a 52-week high. That was the 8th-longest streak of being
within 5% of a high since 1928.
The
S&P also ended its long streak of positive months. It was the first
lower monthly close in 7 months. That's not its longest streak but is one
of the longer ones when trading at an all-time high.
Fortune: Expect Stock Market Volatility in October, by
Anne Straders
In September, Bank of America's "Sell Side
Indicator," the firm's "contrarian measure of Wall Street's
bullishness on stocks, declined to 58.5%." That dip in bullishness
"resonates with our cautious market view, especially heading into the
[third quarter] earnings season, where multiple companies have already issued
disappointing guidance amid a worsening inflation environment," she wrote
in a Friday note to clients.
LPL's
Jeff Buchbinder argues "earnings is the big near term risk"
given how many companies have warned of supply chain issues, he told Fortune.
Meanwhile, although he notes there's a "low probability" of this
happening, Bunchbinder suggests that "if it looks like the Democrats
aren't going to get anything done" in October regarding passing an
infrastructure package, "we can see that as a risk to markets because
investors have priced in some of that spending," he suggests—even if
failing to pass it could mean some relief in terms of tax increases in the near
term.
End
Quote:
"The stock market is filled with individuals who know the price of
everything, but the value of nothing." — Phillip Fisher
.................................................................................................................................
Stay healthy, enjoy life, success, good luck and till next
time….
The Curmudgeon
ajwdct@gmail.com
Follow the
Curmudgeon on Twitter @ajwdct247
Curmudgeon is a retired investment professional. He has been
involved in financial markets since 1968 (yes, he cut his teeth on the
1968-1974 bear market), became an SEC Registered Investment Advisor in 1995,
and received the Chartered Financial Analyst designation from AIMR (now CFA
Institute) in 1996. He managed hedged equity and alternative
(non-correlated) investment accounts for clients from 1992-2005.
Victor
Sperandeo is a historian, economist and financial innovator who
has re-invented himself and the companies he's owned (since 1971) to profit in
the ever changing and arcane world of markets, economies and government
policies. Victor started his Wall Street
career in 1966 and began trading for a living in 1968. As President and CEO of
Alpha Financial Technologies LLC, Sperandeo oversees the firm's research and
development platform, which is used to create innovative solutions for
different futures markets, risk parameters and other factors.
Copyright © 2021 by the Curmudgeon and
Marc Sexton. All rights reserved.
Readers are PROHIBITED from
duplicating, copying, or reproducing article(s) written
by The Curmudgeon and Victor Sperandeo without providing the URL of the
original posted article(s).