The Death of Sanity
By the Curmudgeon with Victor
Sperandeo
Introduction:
Once again, we present illuminating charts and quick
takes that we hope readers find of interest.
In addition, Victor explains the collapse of loans and money velocity as
well as relating the Fed's QE/monetary inflation to future price increases.
We won't be repeating what we've said over and over
about asset bubbles and manias. Let us know what you think of our new format
(email the Curmudgeon at: ajwdct@gmail.com).
Chart-O-Rama:
Since 2007 (which includes the
2007-2009 recession with > 50% drop in stock prices), the stock
market has returned nearly 200%, which is more than twice the growth in GDP and
nearly 4-times the growth in corporate revenue. This disconnect is a function
of the nearly $8 trillion increase in the Fed’s balance sheet, hundreds of
billions in stock buybacks, PE expansion, and ZIRP. With “Price-To-Sales”
ratios at the highest level in history, one should question the ability to
continue borrowing from the future?
Source: Lance Roberts, Real
Investment Advice
...........................................................................................
The chart below shows the ratio of nonfinancial market capitalization to
corporate gross value-added (MarketCap/GVA), which is the single most reliable
valuation measure we’ve introduced over time, based on its correlation with
actual subsequent market returns across history. Notably, U.S. nonfinancial
gross value-added is at a record high. The insanity you’re looking at is
all numerator.
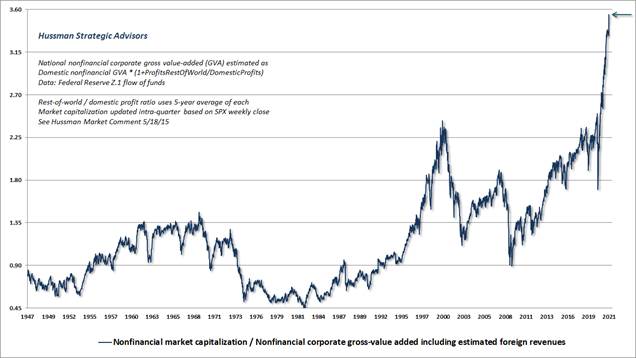
Source: Hussmanfunds.com
This is what a speculative bubble looks like. Jeremy Grantham is
right – “Seriousness is flagged by the language that you use.” Valuations have
reached record extremes while our measures of “uniformity” across market
internals have shown increasing deterioration and dispersion, reflecting
increasing selectivity and emerging risk-aversion. In recent weeks, this
dispersion has widened further. This is serious. Among additional features of
market action to monitor, keep an eye on credit spreads and low-grade bond
yields, as well as any tendency for the number of individual stocks setting
52-week lows to expand – though I suspect those may coincide with stock market
weakness rather than preceding it.
It may be the greatest collective error in the history of investing to
pay extreme multiples for extreme earnings that reflect extreme profit margins
and extreme government subsidies, while imagining that those multiples also
deserve a “premium” for depressed interest rates that reflect depressed
structural economic growth.
…………………………………………………………………………………………..
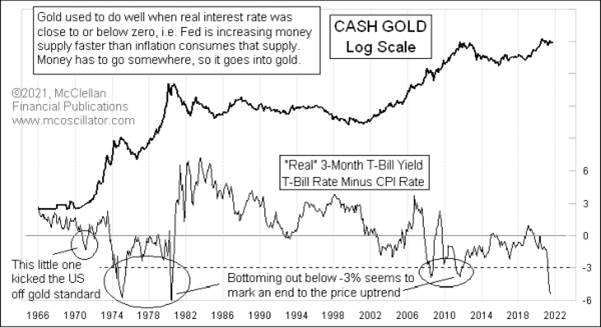
A big negative real yield is a sign of a huge imbalance in the banking
system, and horribly misguided Fed policy.
It says that the Fed is WAAYYYY behind the power curve, and has let inflation
get away from them.
The very real question right now is about whether the
current Fed is not going to do its job, and respond as it would have in the
past to a ridiculous spread between the inflation rate and its short term
interest rate targets. We arguably have
a Fed whose honchos are collectively stupid enough to not only think
that 2% is their goal (statutorily it is 0%), but who also think that 5%+ is
just “transitory” and so they don’t need to do anything about it.
Tom McClellan, The McClellan
Market Report
.................................................................................................
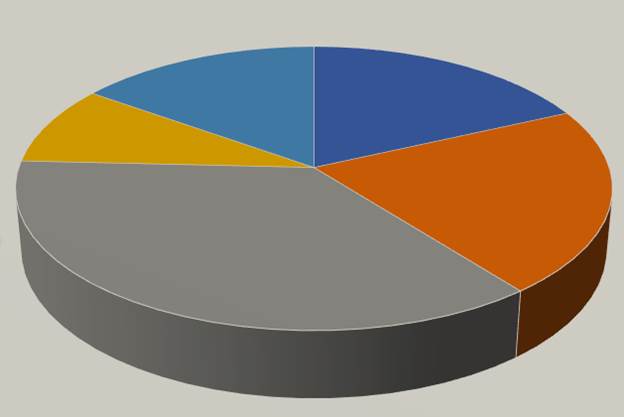
As a researcher focused on confidence and its impact
on decision-making, I can’t shake the feeling that when it comes to risk all
those colorful pie charts (see below) are misleading given where investor
sentiment is today. As I look ahead, the benefits of diversification,
which so many count on to mitigate losses when markets turn down, may not be
there.
All ships (asset classes) have risen together atop an enormous wave of
improving sentiment. While I will leave it to others to debate how we
arrived at this point, what is clear today is that most portfolios are now
comprised almost entirely of assets with extremely high sentiment, devoid of
assets where there is low sentiment, let alone hopelessness.
Put simply, when it comes to mood, every slice of
the pie is now piping hot. Portfolios that investors believe are
well-diversified aren’t. They are highly concentrated in one mood:
euphoria.
................................................................................................
Annual Inflation surged to new record highs in the
July 2021 Producer Price Index (Bureau of Labor Statistics – BLS). The July
2021 Producer (PPI) jumped 1.03% in the month and by a record 7.77%
year-to-year (BLS). The July 2021 Producer Price Index continued to explode
across the board, setting new record levels of year-to-year Inflation at 7.77%
[previously 7.31% (last month)] for the Total PPI-FD (Final Demand), 11.87%
[previously 11.68%] for the PPI-FD Goods Sector and 5.82% [previously 5.18%]
for the PPI-FD Services Sector.
Systemic Turmoil is
just beginning, with both the Fed and U.S. Government driving uncontrolled U.S.
dollar creation, between unconstrained Money Supply growth and uncontained
Deficit Spending. Again, continued extraordinary Monetary and Fiscal Stimulus
will be needed at least into 2022, quite likely into 2023, irrespective of the
nature of the COVID-19 vaccines. Indeed, likely leading into accelerating
inflation, Hyperinflation, both extreme Monetary and Fiscal stimuli are
underway.
.................................................................................................
Bloomberg Business Week April 2019 cover: Is Inflation Dead?
Goehring & Rozencwajg has no doubt: inflation is going to return with a vengeance.
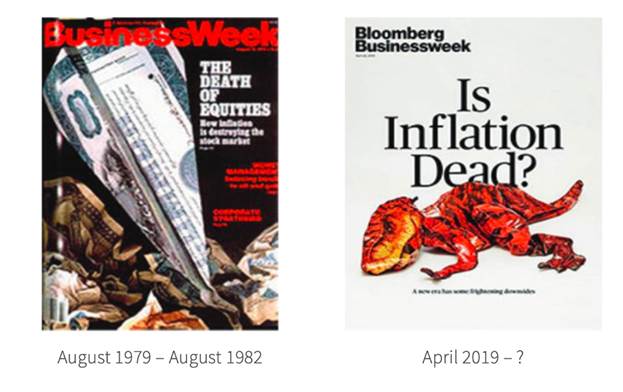
Record-high stock and bond prices clearly signal that investors are
convinced inflation will never return. Investors who read Business Week back in
1979 were tipped off that a trend in place for years — inflation — was about to
reverse with massive investment implications. Readers of BusinessWeek/
Bloomberg in 2019, have now been tipped off that a trend in place for 40
years — disinflation — is about to reverse as well. The magnitude of the
investment implication will be just as large as it was in 1979.
Today’s stock market trades at record high valuation
levels while interest rates have never been lower. The 30-year Treasury yield
hit an all-time low of 1.25% last summer and $15 trillion of sovereign debt now
trades with negative yields — a first in 4,000 years of financial history.
....................................................................................................
Victor- Money Velocity and Inflation:
Surprisingly (or maybe not?), there's very little
discussion of this topic by the mainstream financial media. That despite the well known fact that the
extent of price increases comes from the turnover of money, i.e. the velocity of the money supply [1.].
What most miss is that low interest rates and low
maturity spreads are correlated with low loan activity ... and thus low money
velocity. We explain all this and the
inflation implications of the Fed's "money printing" below.
In the mid 1990s, money velocity was hovering at 2.2.
In the last quarter of 2007 it was 1.97.
However, it's now collapsed to 1.12 (as of July 29, 2021). That's a
decline of 43.4%!
Below is a chart depicting the total collapse of the
M2 money
stock velocity from the St.Louis Fed.
Note 1. The velocity of money
is the frequency at which one unit of currency is used to purchase
domestically- produced goods and services within a given time period. It's the
number of times one dollar is spent to buy goods and services per unit of time.
If the velocity of money is increasing, then more transactions are occurring
between individuals in an economy.
.....................................................................................................
We've stated many times that the Fed essentially paid banks to NOT loan money by paying them
interest on their bank reserves. Without
loans, small business stalls and a large part of U.S. job growth comes from
small business. Hence, the weak U.S. GDP
numbers for the last several years.
Banks lend the money that's on deposit, charging the borrowers a higher
interest rate, and profiting off the long term/short term interest rate spread.
The interest rate banks charge their most creditworthy customers for short term
loans is the prime rate, which is now at 3.25% (since March 16, 2020).
With such tiny spreads, and a low prime rate, banks
have little or no cushion against defaults, and thereby don’t make many short
term loans. Hence, money velocity has
staid at extremely depressed levels (see chart above).
Ironically, that's all caused by the Fed's ZIRP and QE
which has kept both short and long term rates unbelievably low. That in turn
puts a lid on the interest rates banks can charge borrowers such that their
interest rate spread is very small.
As Milton
Friedman famously said, "Inflation is
always and everywhere a monetary phenomenon in the sense that it is and can be
produced only by a more rapid increase in the quantity of money than in
output.”
Hence, the extent of the price increases that RESULT
from inflation (the printing/creation of money "out of thin air") are
a function of the velocity of money. In last week's
Curmudgeon post, I stated that as long as
the Powell led Fed continues its money printing (QE), inflation will NOT BE
TRANSITORY!
In conclusion, we've shown that the Fed is not helping
the U.S. economy or workers by keeping interest rates at virtually zero. Moreover, they've planted the seeds for
further inflation with their non-stop money printing (QE), which has resulted
in the ballooning of so many asset bubbles along with its balance sheet (which
now stands at $8.3T as of August 14, 2021).
...............................................................................................
Stay healthy, enjoy
life, success, good luck and till next time….
The Curmudgeon
ajwdct@gmail.com
Follow
the Curmudgeon on Twitter @ajwdct247
Curmudgeon is a retired investment professional. He has been
involved in financial markets since 1968 (yes, he cut his teeth on the
1968-1974 bear market), became an SEC Registered Investment Advisor in 1995,
and received the Chartered Financial Analyst designation from AIMR (now CFA
Institute) in 1996. He managed hedged equity and alternative
(non-correlated) investment accounts for clients from 1992-2005.
Victor
Sperandeo is a historian, economist and financial innovator who
has re-invented himself and the companies he's owned (since 1971) to profit in
the ever changing and arcane world of markets, economies and government
policies. Victor started his Wall Street
career in 1966 and began trading for a living in 1968. As President and CEO of
Alpha Financial Technologies LLC, Sperandeo oversees the firm's research and
development platform, which is used to create innovative solutions for
different futures markets, risk parameters and other factors.
Copyright © 2021 by the Curmudgeon and
Marc Sexton. All rights reserved.
Readers are PROHIBITED from
duplicating, copying, or reproducing article(s) written
by The Curmudgeon and Victor Sperandeo without providing the URL of the
original posted article(s).