Elevated Stock Market Sentiment, Technical Divergences,
and the Fed
By the Curmudgeon with Victor
Sperandeo
Introduction:
Trading was choppy on Wall Street this week after the
three major stock indexes (DJI, S&P 500, NASDAQ) set all-time highs on
Monday. The downbeat end to the week suggests concern about how strong the
economic recovery will be in the second half of this year.
Inflation is raging, with all gauges accelerating to
the upside. Yet bond prices have
rallied, presumably on expectations of a weakening economy that will reduce
credit demand and slow inflation. 10-year Treasury note interest rates have
fallen to 1.29% (as of July 16th) from around 1.6% at the start of
June. Nonetheless, junk bond-Treasury spreads continue to hover at all-time
lows which indicates incredible complacency.
Go figure?
Most of the U.S. government’s pandemic relief efforts
have ended (no more “stimi” checks to speculate on
meme stocks) and the Federal Reserve is starting to discuss cutting back its
enormous monthly bond purchases (AKA tapering).
Meanwhile, new variants (e.g., Delta) of the
coronavirus are threatening to weaken economies around the world. COVID-19
cases are increasing in the U.S. with pandemic restrictions being reimposed in
some areas, like Los Angeles County’s indoor mask wearing mandate.
There are also many technical divergences that once
were traditional warning signs. Also,
copper prices (often considered a leading economic indicator) have fallen, gold
prices are stagnating, and oil prices are now rolling over. It seems that financial markets are sending
an overall risk-off message from a commodity and fixed income perspective.
Despite all of the above,
investor sentiment remains sky high. That used to be a classic “sell signal,”
especially when valuations were this high for so long and technical negatives
persist (more on that below).
Historical precedents of market behavior have been
cast aside, which confounds many old timers like the Curmudgeon. This time it really is different, or so it
seems? Let’s have a closer look in this article.
Comment and Analysis:
“We’ve been throwing up our hands for a while,” said
Jason Goepfert, president of Sundial Capital Research which publishes the
excellent Sentiment
Trader advisory service.
“For whatever the reason, the market is just rolling
over all these historical indicators that before had a very consistent track
record.”
Yet there are some cracks within the stock market’s
foundation. Jason explained, “There is a
lot of rotation under the surface, with too-few stocks above their 50-day
averages, and low correlations among sectors.”
Here are a few technical negatives that show
newfound hesitancy and anxiety among real investors and professional traders
(not retail amateurs who have no fear of losing money in stocks):
Market breadth (Advance/Decline line) has recently deteriorated—even as
major indexes have continued to hit all-time highs. This price-breadth divergence is particularly
evident on the NASDAQ, as depicted in the chart below, where we see the A/D
line is a rather steep decline as the index rolls over:
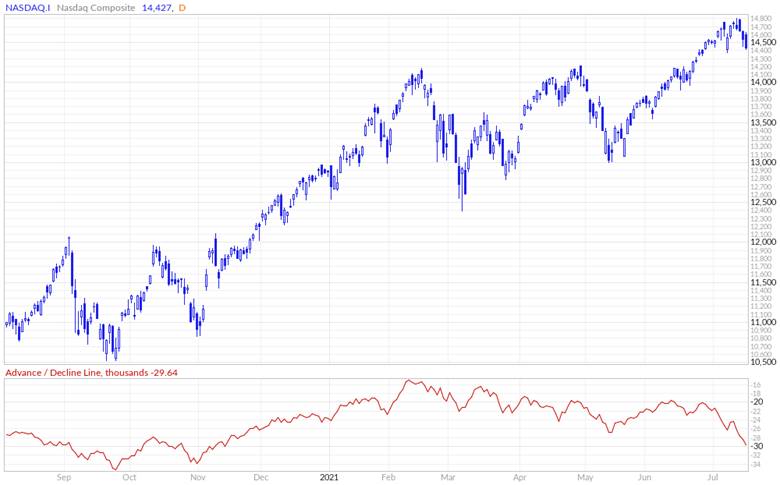
Chart courtesy of Market in and Out
.......................................................................................….
·
As of July 15th,
only about 49% of stocks in the S&P 500 traded above their 50-day moving
averages, according to FactSet, a level that is below average and
one that is a sharp reversal from just a few months ago, when that metric
reached more than 90%.
·
Fewer stocks are hitting new highs. On July 16th,
there were 76 new highs on the NASDAQ vs 125 new lows. That comes with the
NASDAQ composite index only 2% off its all-time high.
·
Stocks of companies most
closely tied to the strength of the economy have slumped, while mega tech
stocks continue to soar to new heights.
·
Small stocks (e.g., Russell
2000) have badly lagged large cap stocks (e.g., S&P 500). On July 13th, there were more new
lows than new highs within the Russell 2000 Index for the second consecutive
day. Over the last six months, the
Russell 2000 Index is up a mere 1.9%. The S&P 500 and Dow have rallied 15%
and 10%, respectively. The relative
under performance of the Russell 2000 could be viewed as a red flag for market
bulls.
·
There have been massive draw
downs in cryptocurrencies, SPACs [special-purpose acquisition companies],
non-profitable tech companies, and meme stocks.
Highlights of July BofA Fund Manager Survey (FMS):
·
FMS Investors are much less
bullish on growth, profits, and yield curve steepening.
·
They have unwound
junk>quality, small>large stock, value>growth stock trades back to
Oct'20 levels (pre-vaccine/election).
·
FMS investors maintain big
longs in stocks (big tech) and commodities.
·
Cyclical "boom" has
peaked: July growth expectations are at 47%, down from the 91% peak in March
2021.
·
Global GDP & EPS readings
show macro momentum weakest since Q3 2020.
FMS economic expectations have peaked - Net % of
Respondents that say Global Economy Will Improve:
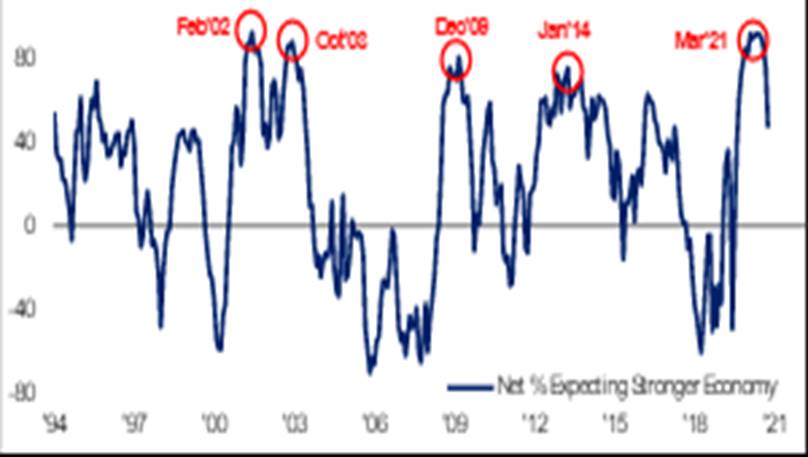
Chart Courtesy of Bank of America Global Research
……………………………………………............…............…........…....….
·
Fiscal optimism is fading: FMS expectation for U.S. infrastructure stimulus is
down to $1.4tn (was $1.9tn in April 2021).
·
Investors predicting higher
inflation is way down at 22% (was 93% in April).
Inflation expectations fall drastically-Net % Expecting
Higher Global CPI:
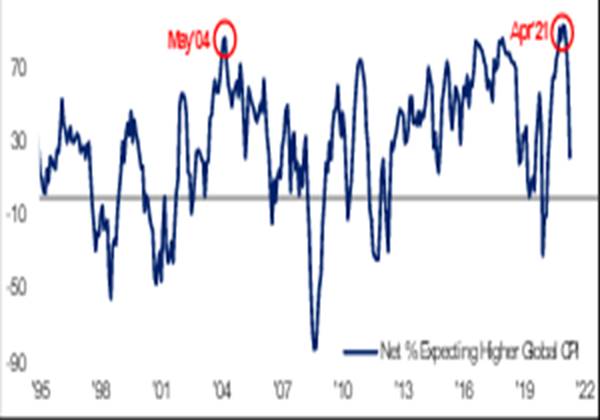
Chart Courtesy of Bank of America Global Research
……………………………………………............…............…........…....….
·
Expectations for steeper
yield curve are at 2-year lows, despite FMS investors belief that the first Fed
rate hike will be in January 2023 vs previous expectation of November
2022. That’s
shown in the chart below.
Expectations for a steeper yield curve fall
drastically -Net % Expecting Steeper Yield Curve:
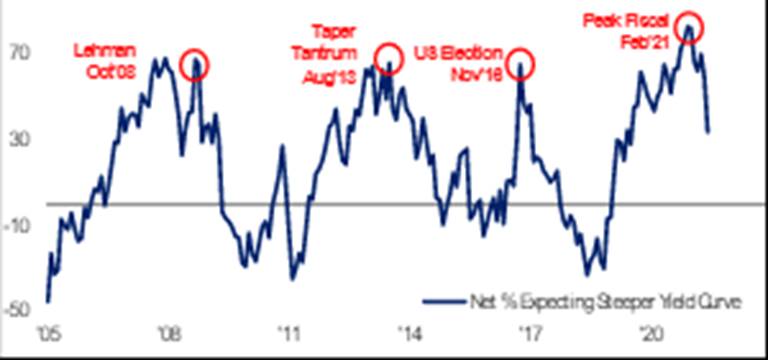
Chart Courtesy of Bank of America Global Research
........…..…....…......…....…....…....…....…....…....…....…..…....…..….....
Earnings Beats and the Stock Market:
Following 1st Quarter 2021 earnings
season’s biggest beat in U.S. history (+23%), Wall Street analysts have
increased earnings estimates by 7% for the 2nd Quarter. That’s the biggest
upward revision since 2000!
B of A is expecting corporate earnings to beat
analyst estimates by 11% in the 2nd half of 2021. However, the bank warns that blowout earnings
don't always correspond to rising stock prices. Since
1996, 75% of down quarters (excluding the Great Financial Crisis) occurred in
quarters with earnings beats. In 2000, despite earnings beating analyst
consensus for 10 straight quarters, the S&P 500 declined for four
consecutive quarters.
Cartoon of the Week:
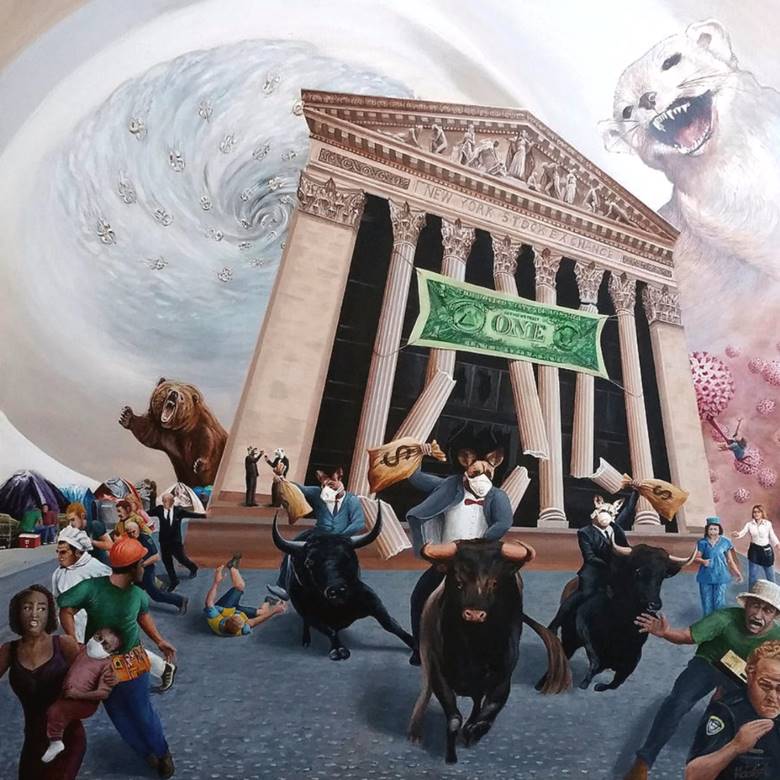
The painting “COVID Declared a Pandemic – 2020”, by
Hadi Aghaee at the Triton Museum in Santa Clara, CA
..............................................................................................………
Victor’s Comments – a Historical Perspective:
In 1971, I started an option’s firm called Ragnar
Option Corp. We traded OTC puts and calls.
As the CEO owning 1/3 of the firm, I handled the discretionary trading
and the inventory. We made firm markets on the (then illiquid) put and call
options business. We were very successful! I also
traded futures when the situation called for it. Thereby, I learned my knowledge of Wall
Street trading via derivatives.
Around 1972, I learned about investing by reading the
Federal Reserve Board meeting minutes back to 1959. Indeed, the Fed had a great deal of influence
on the markets.
At the time, I was an Economic/Finance major attending
evening classes at City College of New York.
During the day, I became a technical analyst/tape reader while closely
observing market trading. My college
education only taught me about Money and Banking – nothing about the Fed that
really counted.
One day I came across the term “Fed Funds,”
but did not know exactly what that term meant.
Yes, it was cash, but what was the Fed Funds Rate? I decided to ask all my friends, who were
mostly option and futures traders. Of the eight traders I asked, not a single
soul knew exactly what the Fed Funds Rate was! That’s
because in 1972, the Fed was relatively unknown by today’s standards. Today, of course everyone on Wall Street
knows what it means as well as do most soccer moms!
The key to the above story is that people like me had
a huge trading edge at the time. But
today, everyone has learned that the Fed is King, so much so that the
expression “Don’t fight the Fed” became an axiom.
Today, when Fed monetary policy is so easy, stock
market sentiment gets very high and stays
elevated. That’s
in sharp contrast to the 1970’s when metrics like P/E ratios, Price to Book
ratios, Advance/Decline lines, etc. were much more meaningful in assessing or
forecasting stock prices.
Graham and Dodd’s teachings from their book “Security
Analysis” was what the Street focused on then, along with the “Intelligent
Investor,” also by Benjamin Graham. For traders, “The Technical Analysis
of Stock Trends,” by Edwards and MaGee was the
Bible. Today, reading and following the guidelines of those great books may
well lose you money!
....…......…....…..…....…..…....…..…..…....…..…..…....…..…....…….
Curmudgeon Note: In a December 6, 2017
webcast, Bank of America’s top U.S. market strategist Savita Subramanian said,
“Dodd and Graham? We don’t
use that here anymore. Hah, hah, hah.” Yet that book was her “bible” when she
studied finance at Columbia Business School (2002) as per this
post.
....…......…....…..…....…..…....…..…..…....…..…..…....…..…....…….
The bottom line is everyone is now aware of the Fed
and its “Printing Press” power, so what you see is what you get. However, stock
prices are also moving up on goods and services prices increasing (i.e.,
inflation). It appears that as long as the Fed wants to prevent U.S. economic growth
from turning negative, it will put petal to the metal and print more money, regardless
of if inflation is above their 2% target.
QE + ZIRP keeps asset prices very high, as
we’ve stated for many years now.
Victor’s Conclusions:
The Fed chooses to ignore the killer problem of
inflation, especially for those in retirement or on a fixed income. I believe
consumer price inflation will continue at rates from 3.5%-to-5% and accelerate
from that base (the Curmudgeon concurs).
As long as QE and ZIRP continue, asset prices will stay high and income
inequality will widen.
Today’s “investors” are believers and are profiting
from this speculative mania without any reference to value or the warnings of
Benjamin Graham. Currently high stock
(and bond) valuations have never proven to be a good investment. Therefore, I
suggest this quote guide you:
“Whatever begins, also ends.” Seneca the Younger.

End Quotes:
“Markets are just doing their own thing. Something
has changed. Whether it’s unprecedented stimulus or
maybe there is this generational change with young investors. This new surge
into the market keeps driving stocks higher,” Jason Goepfert, president of
Sundial Capital Research.
“I feel as anxious today as I’ve ever felt about the
financial world, because of my belief that the Fed has been pumping up asset
prices in a way that is creating a bit of an illusion. And I think it — I think the odds are now
sort of one in three, very high, that we will look at
this as an epic mistake and one of the great financial calamities of all time.”
Peter R. Fisher spent more than a decade working at
the Federal Reserve Bank of New York. Now, citing what he describes as
“financial mania,” he has a warning about the actions of the Fed system of
which he was once part.
.…........…......…....…..…....…....…..…....…....…..…..…....…..…....…..….
Stay healthy, enjoy life, success, good luck and till
next time….
The Curmudgeon
ajwdct@gmail.com
Follow
the Curmudgeon on Twitter @ajwdct247
Curmudgeon is a retired investment professional. He has
been involved in financial markets since 1968 (yes, he cut his teeth on the
1968-1974 bear market), became an SEC Registered Investment Advisor in 1995,
and received the Chartered Financial Analyst designation from AIMR (now CFA
Institute) in 1996. He managed hedged equity and alternative
(non-correlated) investment accounts for clients from 1992-2005.
Victor
Sperandeo is a historian, economist and financial innovator who
has re-invented himself and the companies he's owned
(since 1971) to profit in the ever changing and arcane world of markets,
economies and government policies.
Victor started his Wall Street career in 1966 and began trading for a
living in 1968. As President and CEO of Alpha Financial Technologies LLC,
Sperandeo oversees the firm's research and development platform, which is used
to create innovative solutions for different futures markets, risk parameters
and other factors.
Copyright © 2021 by the Curmudgeon and
Marc Sexton. All rights reserved.
Readers are PROHIBITED from
duplicating, copying, or reproducing article(s) written
by The Curmudgeon and Victor Sperandeo without providing the URL of the
original posted article(s).