Fed T-Bill
Buying Persists Despite Ultra Easy Financial Conditions
By the
Curmudgeon
Disclaimer:
Victor said he had nothing new to add to this week’s
Curmudgeon post, but is working on a future piece tentatively titled,
“Financial Chicanery and Fed Sorcery.”
It will detail how the U.S. Federal Reserve and U.S. Treasury have
created a merry-go-round system where banks can purchase U.S. Treasuries at no
risk in their Held-to-maturity (HTM) securities account.
Introduction:
With all the news about the coronavirus, Friday’s strong jobs
report, Trump’s celebration of his impeachment acquittal, and the U.S.
Democratic Party is disarray, we prefer to not comment on those topics. Instead, we expose the dichotomy of:
1.] The Fed increasing its balance sheet (again) to liquefy
the repo market (which is supposedly short of cash?) by buying Treasury bills
and mortgage securities….
2.] Multi-decade lows in two Federal Reserve measures of
financial market stress indicates there is plenty of liquidity to fuel
financial markets.
We hope that you appreciate several eye-popping charts we’ve
included, especially T-bills on the Fed’s Balance Sheet. It may be quite difficult to get your brain
to reconcile them.
A Peek at the Fed’s
Balance Sheet Trend:
Victor and I as well as many others noted that the Fed
started to end its “runoff program,” whereby they would no longer submit
proceeds of maturing securities (Treasuries and mortgage bonds) they owned to
the U.S. Treasury, but instead roll them over by purchasing similar
securities. Our piece was titled: Fed’s Balance Sheet Runoff
is All About Bank Reserves; Who Does the Fed Represent?
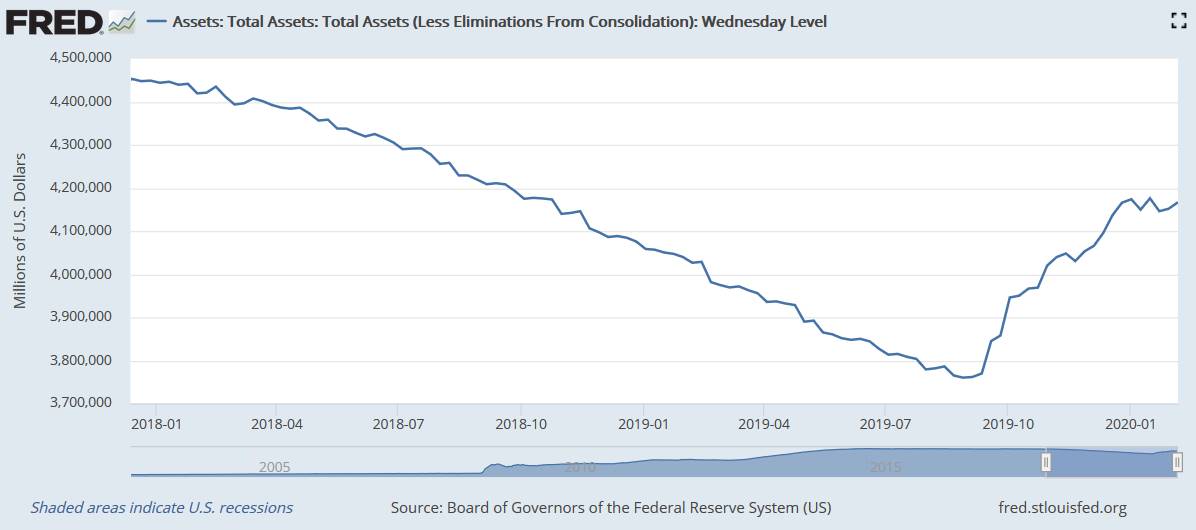
In the graph below, one can clearly see the steady decline in
the Fed’s balance sheet up till September 4, 2019 when the Fed commenced buying
T-Bills (and later mortgage securities) to provide liquidity to the repo
market. The Curmudgeon analyzed that
dynamic in a blog post titled: Fed Launches New Round of QE
with a Stated Different Purpose.
The “hockey stick” like upturn in the graph below seems to
now be leveling out at $4.17 Trillion—not too far from the $4.5 Trillion peak
in the Fed’s Balance Sheet.
………………………………………………………………………………………….
The Fed’s Repos and
T-bill Scorecards:
Total repos on the Fed's balance sheet of February 5th (released
Thursday afternoon February 6th) have plunged by $85 billion from
the peak on January 1, to $170 billion, below where they'd first been on
October 2, 2019. This is seen in the
graph below:
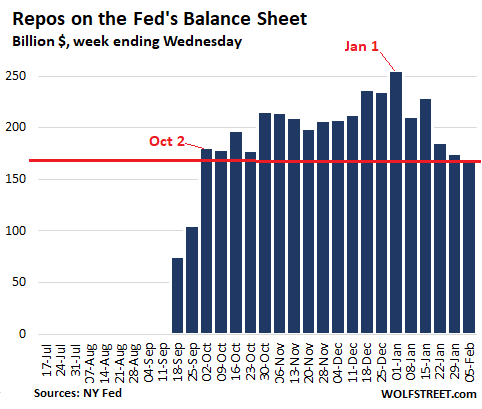
Under these "repurchase agreements," the Fed buys
Treasury securities and mortgage-backed securities (MBS), guaranteed by Fannie
Mae and Freddie Mac or Ginnie Mae, whereby the counterparties commit to buy
back these securities at a fixed price on a specific date, such as the next day
(overnight repo) or a longer period, such as 14 days (term repo). Repos are by definition in-and-out transactions. When a repo matures
and unwinds, the Fed gets its money back, and the repo on the Fed's balance
sheet goes to zero.
By buying these securities, the Fed adds liquidity to the
market for the duration of the repo. When the repo matures and unwinds, the
liquidity gets drained from the market. When a new repo transaction occurs, the
process starts over again, but with a different amount and with a different
maturity date.
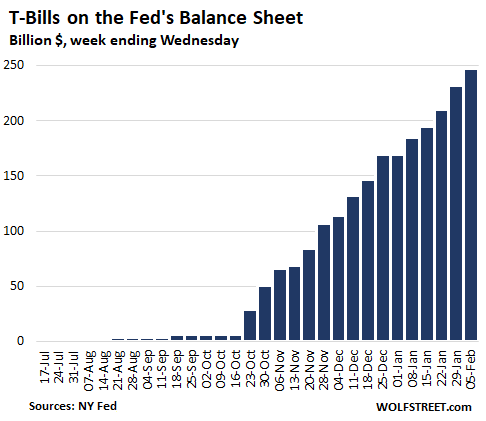
Meanwhile, The Fed continued to increase its ballooning
holdings of T-bills (Treasuries with maturities of one year or less) at a rate
of about $60 billion per month. To increase its stash, the Fed has to buy the amount of the maturing T-bills, and it has to
buy the amounts needed to obtain the targeted increase of about $60 billion a
month.
Over the five weekly balance sheets since January 1, the Fed
has added $78 billion in T-bills, and the total amount of T-bills on the Fed's
balance sheet has now ballooned to $248 billion (see graph below). These
T-bills are a major part of the Fed's strategy to bail out the repo-market. The
Fed’s T-bill purchases are supposedly an attempt to increase Excess Reserves
that Fed member banks have on deposit at the Fed (for which they earn interest
and are in effect paid not to lend money).
The Fed blames low Excess Reserves last September for the
banks' refusal to lend to the repo market, which then caused the repo market to
blow out. So, bringing up Excess Reserves to an "ample" level is the
goal of these T-bill purchases. Once that "ample" level is reached,
the Fed said it will back off this program.
……………………………………………………………………………………………………………..
“The Fed’s extremely aggressive response to the repo blowout
in September, as well as their timidity in pulling back from that
response could be signaling to markets that this is a Fed with a very low
tolerance for market fluctuations,” said Blake Gwinn, a strategist at NatWest
Markets, who joined the bank last year from the markets group at the New York
Fed.
…………………………………………………………………………………………………….
Opinion:
The Curmudgeon believes
the so called “ample” level of excess reserves was reached a long time ago and
the Fed is disguising the real purpose of its T-bill buying which is a ploy to
prop up U.S. stock and bond markets. That despite they are both egregiously
over-valued from a historical perspective.
As the Fed has bought
T-bills with money created out of thin air, some of that new money has flowed
into stocks, derivatives (like futures, options, structured products, and ETFs)
and corporate/junk bonds, pushing prices significantly higher.
…………………………………………………………………………………………………….
Financial Stress
Conditions at Multi-Decade Low:
Several analysts (and the Curmudgeon) have wondered why the
Fed needs to liquefy the repos market when overall liquidity seems to be
plentiful. [Victor says that it’s
because there’s not enough bank cash in the repos market, even though there are
plenty of excess bank reserves].
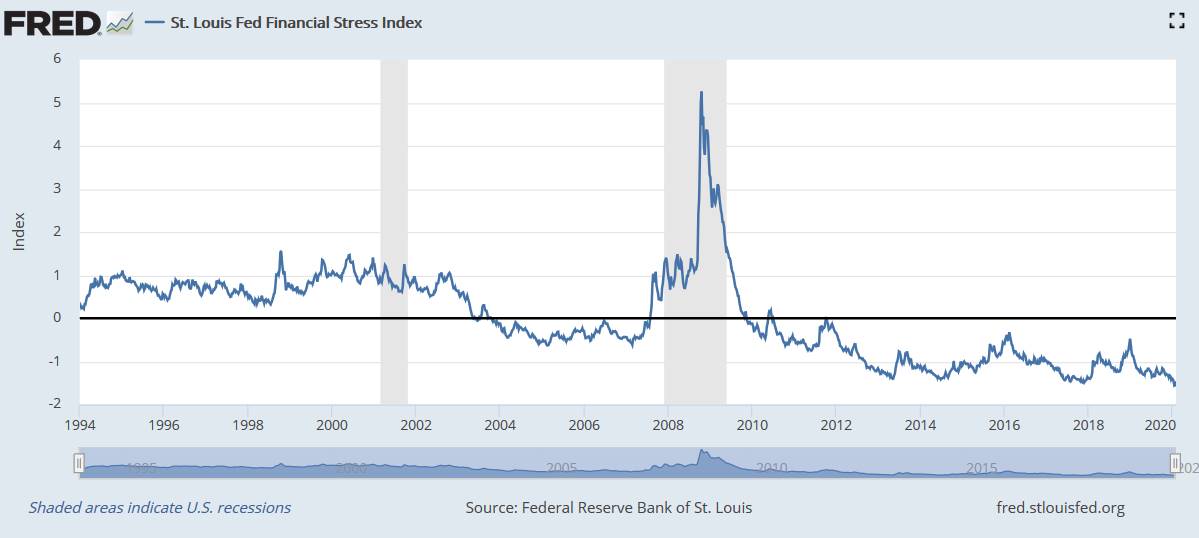
Let’s look at two measures the Federal Reserve uses to gauge financial market stress and liquidity:
1. The St Louis Fed
Financial Stress Index (STLFSI) measures
the degree of financial stress in the markets and is constructed from 18 weekly
data series: seven interest rate series, six yield spreads and five other
indicators. Each of these variables captures some aspect of financial stress.
Accordingly, as the level of financial stress in the economy changes, the data
series are likely to move together.
The STLFSI fell to
-1.6 for the week ending January 17th (readings are monthly). That was the lowest level since the index was
created at the end of 1993.
Citation:
Federal Reserve Bank of St. Louis, St. Louis Fed Financial Stress Index
[STLFSI], retrieved from: https://fred.stlouisfed.org/series/STLFSI, February
9, 2020.
Note: The average value of
the STLFSI, which began in late
1993, is designed to be zero. Thus, zero is viewed as representing normal
financial market conditions. Values below zero suggest below-average financial
market stress, while values above zero suggest above-average financial market
stress.
……………………………………………………………………………………………………
2. The Chicago Fed's National Financial Conditions
Index (NFCI) provides a comprehensive weekly update on U.S. financial
conditions in money markets, debt and equity markets and the traditional and
"shadow" banking systems. Positive values of the NFCI indicate
financial conditions that are tighter than average, while negative values
indicate financial conditions that are looser than average.
The NFCI was at -0.79 on January 31st, which is a
smidgen higher than its multi-decade low of -0.80 reached two times in
2019. That index has been negative since
January 2012, implying that financial conditions have been lose (easy money)
for a very long time.
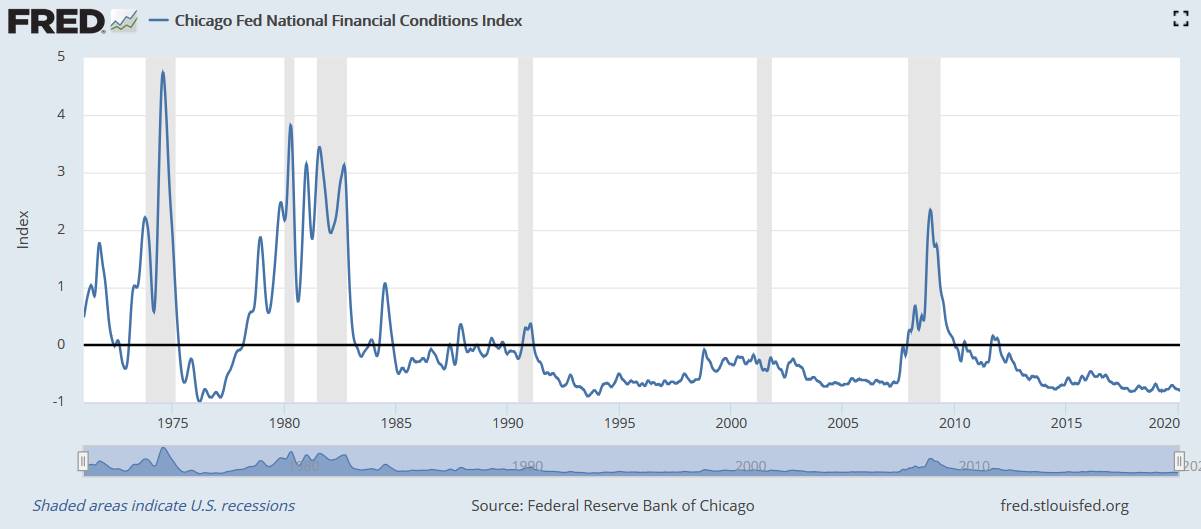
Citation: Chicago Fed National Financial Conditions
Index [NFCI], retrieved from: https://fred.stlouisfed.org/series/NFCI, February
9, 2020.
……………………………………………………………………………………………………………..
Conclusions:
How does one reconcile the continued Fed purchases of T-bills
when junk bond yields are at all-time lows, stock market indices are at
all-time highs, mortgage rates are at multiyear lows, real rates on all
Treasuries are negative and financial conditions are at multi-decade levels of
easy money?
One would think such new money creation at this time would
cause accelerating inflation, but that isn’t happening because the newly
“printed” money never gets into the real economy. Instead, it gets deposited at the Fed rather
than being lent out and some of it finds its way into financial markets. That
is where the inflation is today!
Closing Quotes:
“The expansion of the Fed’s balance sheet — whether [the Fed]
calls it QE or not — is good for risk sentiment,” said Scott DiMaggio, co-head
of fixed income at Alliance Bernstein
in New York.
“The Fed goes out and buy bills, the seller of bills then
buys coupons, the seller of coupons then buys credit and the seller of credit
buys riskier credit,” said Andrew Brenner, head of international fixed income
at Nat Alliance Securities. “There
is so much excess money,” he added.
“I don't mean to be disrespectful, but it seems
counter-intuitive that an index measuring financial
market stress can be at an all-time low when at the same time the Federal
Reserve feels it is necessary to add $400 billion due to repo market
illiquidity,” Peter
Atwater tweeted to the St. Louis Fed.
…………………………………………………………………………………………………….
Good luck and till next time….
The Curmudgeon
ajwdct@gmail.com
Follow
the Curmudgeon on Twitter @ajwdct247
Curmudgeon is a retired investment professional. He has
been involved in financial markets since 1968 (yes, he cut his teeth on the
1968-1974 bear market), became an SEC Registered Investment Advisor in 1995, and
received the Chartered Financial Analyst designation from AIMR (now CFA
Institute) in 1996. He managed hedged equity and alternative
(non-correlated) investment accounts for clients from 1992-2005.
Victor
Sperandeo is a historian, economist and financial innovator who
has re-invented himself and the companies he's owned (since 1971) to profit in
the ever changing and arcane world of markets, economies and government
policies. Victor started his Wall Street
career in 1966 and began trading for a living in 1968. As President and CEO of
Alpha Financial Technologies LLC, Sperandeo oversees the firm's research and
development platform, which is used to create innovative solutions for
different futures markets, risk parameters and other factors.
Copyright © 2020 by the Curmudgeon and
Marc Sexton. All rights reserved.
Readers are PROHIBITED from
duplicating, copying, or reproducing article(s) written
by The Curmudgeon and Victor Sperandeo without providing the URL of the
original posted article(s).