S&P
500 Forecasts Bullish but Prices Bolstered by Buybacks and ETFs, Not Earnings
By the
Curmudgeon
Introduction:
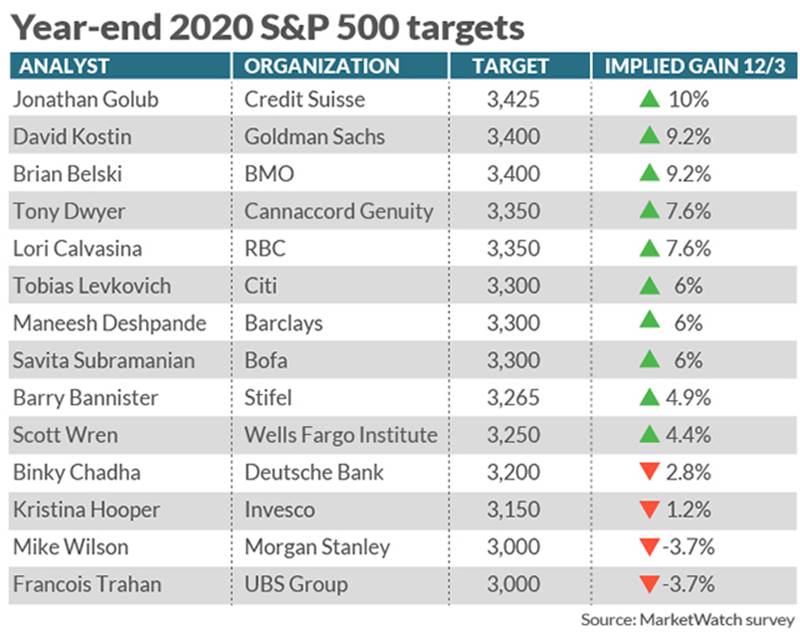
2020 stock market forecasts issued by the big investment banks and
brokerage houses are out and, as expected, they are mostly bullish. Only four of 14 firms forecast a negative
return for the S&P 500 next year as shown in the following table:
We caution readers not to put too much faith in these forecasts. Why? Because they have a dismal track record. The main reason is that stock market
forecasts are typically based on earnings growth for the coming year. In fact, CFA Institute (and other) students
are taught that earnings are the number one driver of stock prices. Based on 2019 stock market performance, that
no longer seems to be true.
Do
Earnings Still Drive Stock Prices?
In this new era of never-ending financial bull markets, we wonder if the
stock market even cares about earnings anymore.
That’s in light of S&P 500 3Q-2019 YoY
earnings decline of -2.3% with the index +24% YTD.
Recent stock market performance seems to be driven by valuation swings,
corporate stock buybacks, central bank ultra-easy money policies, negative
nominal (and real) interest rates. The
old tool kit, consisting of fundamentals, technical analysis, cycles,
sentiment, etc. seems to be a thing of the past. Only monetary policy remains as a classical
market metric. Hence, stock prices have become impossible to forecast
accurately.
Let’s look at P/E ratio, which has become greatly distorted by share
buybacks which reduce the number of outstanding shares of stock. The S&P
500 is currently at a relatively high 23x earnings (without buybacks it would
be much higher). Historically, investors have been willing to pay anywhere
between 5x and 40x earnings for the U.S. market. That valuation swing
translates in anything from a 70% gain in stocks to a 70% decline. With interest rates so low and monetary
policy so easy, it is highly unlikely that the P/E ratio will decline to single
digits, which makes a major stock market decline unlikely in 2020- an election
year in the U.S.
However, we have been in an earnings recession for quite some time as
documented in previous Curmudgeon posts and elsewhere, like this piece
from Morgan Stanley Wealth Management:
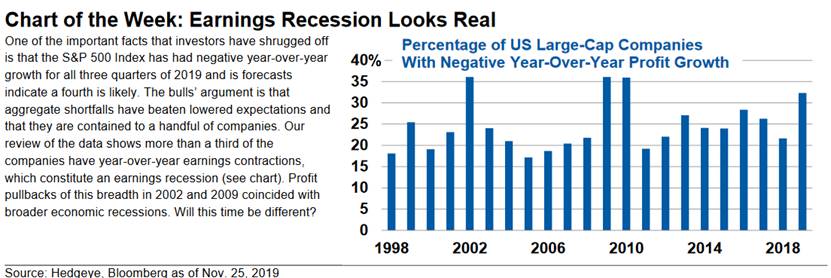
Morgan Stanley found that more than a third of S&P 500 companies have
posted a year-over-year decline in earnings in 2019. The last times the share
of companies posting contracting earnings was that high: 2009, 2008 and 2002,
all periods when the broader economy, plus the stock market, were in
decline. The investment bank forecasts
that the S&P 500 will end 2020 at 3000 and will be at 2750 by Dec 31, 2019
(vs 3146 as of Dec 6, 2019).
……………………………………………………………………….
Here’s a terrific chart showing S&P 500 Price Level vs. After Tax
Corporate Profits (1970- Present):
Source:
St. Louis Fed, Yahoo Finance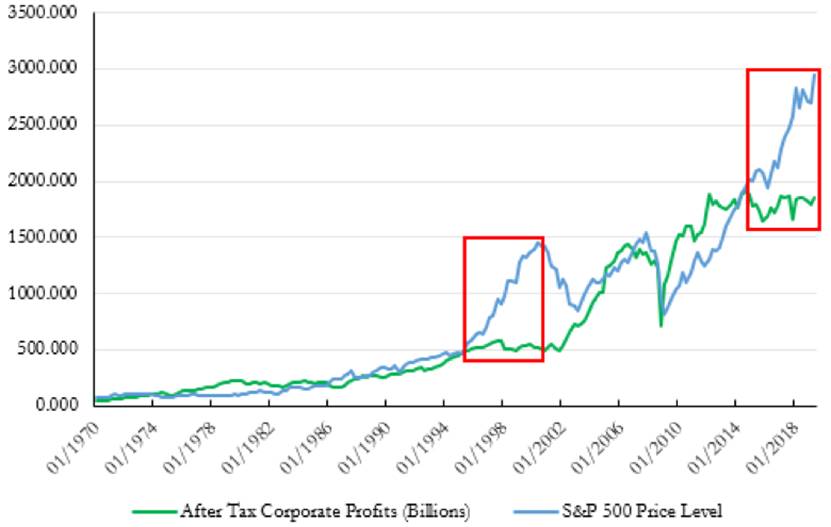
The red box on the right shows that S&P 500 after tax profits (not EPS which
is distorted by buybacks) peaked five years ago in 2014 and have been basically
flat since then. JULEX Capital reflected on this dichotomy in a December 6th blog post:
Although the stock market
continues reaching record highs, companies are making less than they did five
years ago, so this performance is largely driven by P/E expansion.
There is good reason to
believe that the current environment represents a fundamental mispricing in the
stock market. For instance, applying a linear model to the most recently
available earnings data would yield a predicted S&P 500 price level of
below 2566 with 97.5% probability, quite the far cry from the current levels of
over 3100.
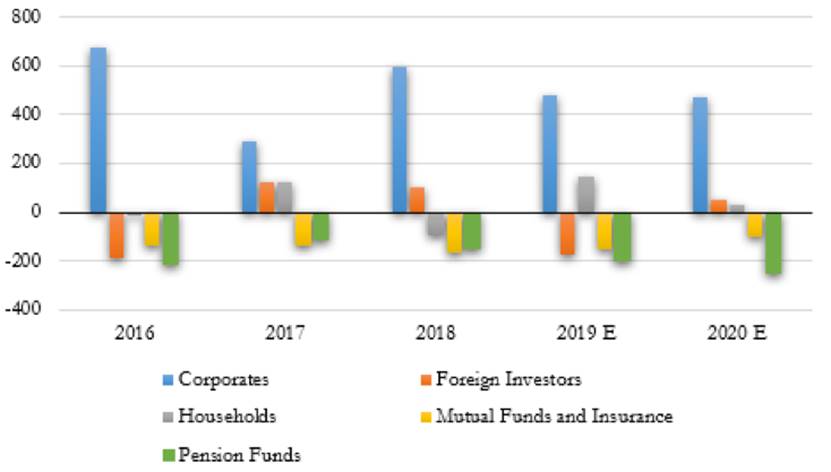
Corporate
Stock Buybacks:
A large part of this P/E expansion can be attributed to aggressive
corporate buybacks. According to Goldman Sachs’ Research Team, only
corporations and households have been net buyers of equities since 2015, with
buybacks accounting for a large majority of the demand (see chart below). If
the market loses this key piece of support going forward, either through
government regulation or from natural causes (e.g. difficult to do buybacks
without a significant increase in after tax earnings), then one would expect
equities to come back down to more reasonable valuations. But don’t bet on it!
Net Equity Demand by Category (Billions)
 …..……………………….……………………………………..…..
Bearish Analysts Comments:
Morgan Stanley’s Michael Wilson is one of the more bearish analysts on Wall
Street. “Easier monetary policy and trade stabilization will help global growth
accelerate, but only stabilize GDP growth in the US at 1.8%, leaving pressure
on corporate margins from tight labor markets,” he wrote in a note to clients.
Wilson argued that central bank stimulus may keep stock prices elevated in
the near term, “but by April, the liquidity tailwind will fade
and the market will focus more on fundamentals, where uncertainty is higher
than normal.”
He believes that profit margin headwinds and sluggish U.S. economic growth
will keep earnings gains nearly non-existent, as has been the case in 2019,
while international trade and policy uncertainty will keep a lid on equity
valuations.
UBS’ Francois Trahan also has a target of 3,000 on the S&P 500 for the
coming year, driven by what he predicts will be an earnings recession — or two
or more consecutive quarters of declines in S&P 500 earnings.
“Directly in front of us, we see S&P 500 forward earnings falling and
expect them to remain under pressure for several quarters,” Trahan wrote in a
recent 2020 outlook note. He said that earnings declines
in small cap stocks are presaging what will happen to large caps as a slowing
of economic growth, which began in 2019, continues next year.
Tim
Quast on ETFs Influence on the Market:
Our long-time colleague Tim Quast, principal of ModernIR
[1.] has several cogent comments on how ETFs are artificially propping up stock
prices.
Note 1. ModernIR is the No.1 Market Structure Analytics™ firm in the
Investor Relations (IR) profession, serving a rapidly growing client base in
excess of $1.5 trillion in market capitalization.
……………………………………………………………………..
ETFs are fostering inflation in stocks precisely the same way issuing
excess currency beyond the market’s requirements diminishes purchasing
power. ETF shares continue to expand at
an eye-popping pace even as investors exit U.S. equities via net redemptions
(the WSJ said over the weekend that investors have pulled a net $135 billion
this year from equity mutual funds).
How is
it possible to create more ETF shares as money leaves U.S. equities? Very easy:
Create them WITHOUT accumulating the underlying stocks (academics refer
to this as “operational shorting,” Professor Rich Evans from UVA in Charlottesville
VA wrote a paper on it, and I moderated a panel with him in June this year to
discuss it). Selling ETF shares that
have no associated underlying collateral inflates prices, because arbitragers
trade the ETF shares up in line with the benchmarks they track – which in turn
pulls stock prices up too.
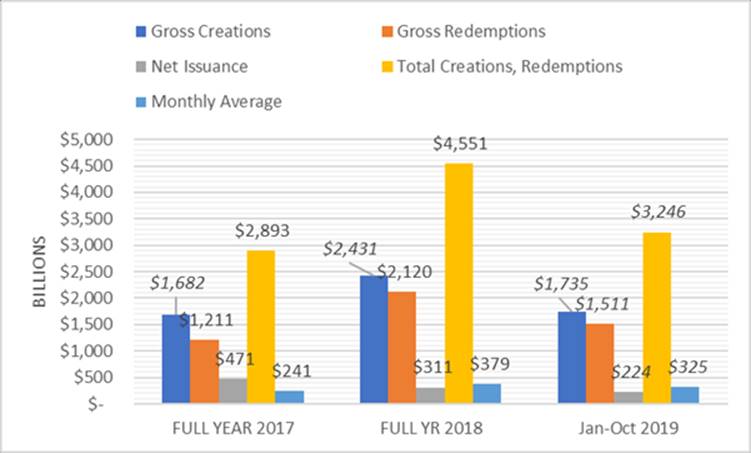
We track the ETF data from the Investment
Company Institute every month.
There’ve been $3.2 TRILLION of ETF creations and redemptions this year,
with creations outstripping redemptions
by $224 billion (monthly average of $325 billion total create/redemptions
per month in 2019 through October, the most recent data available). From ICI’s November 26th report:
Assets of all exchange-traded funds rose in October 2019 by $105.36
billion, or 2.6 percent, to $4.13 trillion. Over the past 12 months, ETF assets
increased $653.77 billion, or 18.8 percent. Assets in domestic equity ETFs
increased $323.81 billion since October 2018, and global equity ETF assets rose
$93.84 billion during this period. At the end of October 2019, assets of bond
funds were $793.89 billion and hybrid funds were $29.23 billion and commodity
funds were $85.47 billion.
During October 2019, the value of all ETF shares issued exceeded that of
shares redeemed by $28.61 billion. In October 2018, the value of all ETF shares
issued exceeded that of shares redeemed by $7.93 billion.
ETF Data from Investment Company Institute
……………………………………………………………………….
End Quote (courtesy of Victor):
“Just because something isn't a lie does not mean
that it isn't deceptive. A liar knows that he is a liar, but one who speaks
mere portions of truth in order to deceive is a craftsman of destruction.”
àThe Fed does not understand this!
― Criss Jami
……………………………………………………………………………………………..………………………………………………………………………………………….
Good luck and till
next time……
The Curmudgeon
ajwdct@gmail.com
Follow
the Curmudgeon on Twitter @ajwdct247
Curmudgeon is a retired investment professional. He has
been involved in financial markets since 1968 (yes, he cut his teeth on the
1968-1974 bear market), became an SEC Registered Investment Advisor in 1995,
and received the Chartered Financial Analyst designation from AIMR (now CFA
Institute) in 1996. He managed hedged equity and alternative
(non-correlated) investment accounts for clients from 1992-2005.
Victor
Sperandeo is a historian, economist and financial innovator who
has re-invented himself and the companies he's owned (since 1971) to profit in
the ever changing and arcane world of markets, economies and government
policies. Victor started his Wall Street
career in 1966 and began trading for a living in 1968. As President and CEO of
Alpha Financial Technologies LLC, Sperandeo oversees the firm's research and
development platform, which is used to create innovative solutions for
different futures markets, risk parameters and other factors.
Copyright © 2019 by the Curmudgeon and
Marc Sexton. All rights reserved.
Readers are PROHIBITED from
duplicating, copying, or reproducing article(s) written
by The Curmudgeon and Victor Sperandeo without providing the URL of the original
posted article(s).