Are U.S. Stocks in a Bear Market or Just a Correction?
by the Curmudgeon
To answer this question, let’s look at several
reliable sources for guidance and direction:
1. As of
December 7th, Leuthold
Group’s Major Trend Index says “This Is a Bear Market.” Leuthold’s Chief Investment Officer &
Portfolio Manager Doug Ramsey writes:
The Major Trend
Index (MTI) fluctuated within its
negative zone throughout November before closing the month at a
decisively-bearish ratio of 0.76. Consistent with the high-risk environment
suggested by the MTI and other evidence, the Leuthold Core and Global Funds
remain positioned with net equity exposure of about 37%.
It’s notable
that the MTI improved very little in response to either of the two minor lows
of the fall correction, or to the two ensuing rallies. In the case of the former,
we expected more combined improvement in the MTI’s “countertrend” categories
(Intrinsic Value and Attitudinal); in the latter, a bigger reversal in the
Momentum/Breadth/Divergence work should have occurred (although that’s still
possible). If the rally that began the last week of November continues without
significant MTI improvement, we will move Core Fund net equity exposure to the
very bottom of its 30-70% guideline range. We won’t rule out doing the same in
the Global Fund, although in the wake of bear-sized losses suffered by many
foreign markets, we note the valuation profile of the Global Fund’s long equity
position is much lower than that of the Core Fund. (In fairness, foreign
equities were much cheaper than domestic stocks before those losses.)
Modest
improvement in the Economic/Interest Rates/Inflation category during the month
masked a major shift within key indicator groupings. Leading inflation measures
have faded sharply, with upgrades across the board in the commodity readings,
and (most recently) a big jump in the NOPE Index, which moved back into its
bullish zone with the ISM update for November. Gains in the inflation work,
however, have been offset by steady deterioration in the monetary and liquidity
measures—including interest rate momentum, money growth, and the yield curve.
That leaves us wondering whether the drop in inflation
pressures is even a bullish thing. Not every expansion ends with an “overheat.”
……………………………………………………………………………………………………………………………………………………
2. The late
and great Richard Russell of the now
defunct Dow Theory Letters developed
his proprietary Primary Trend Index
(PTI) for the U.S. stock market in the 1960s. It is composed of 8
indices, all geared to market action.
The PTI has been very reliable in identifying the major stock market
intermediate and long-term trends. Currently, it is just barely in the bearish
camp as can be seen from these charts:
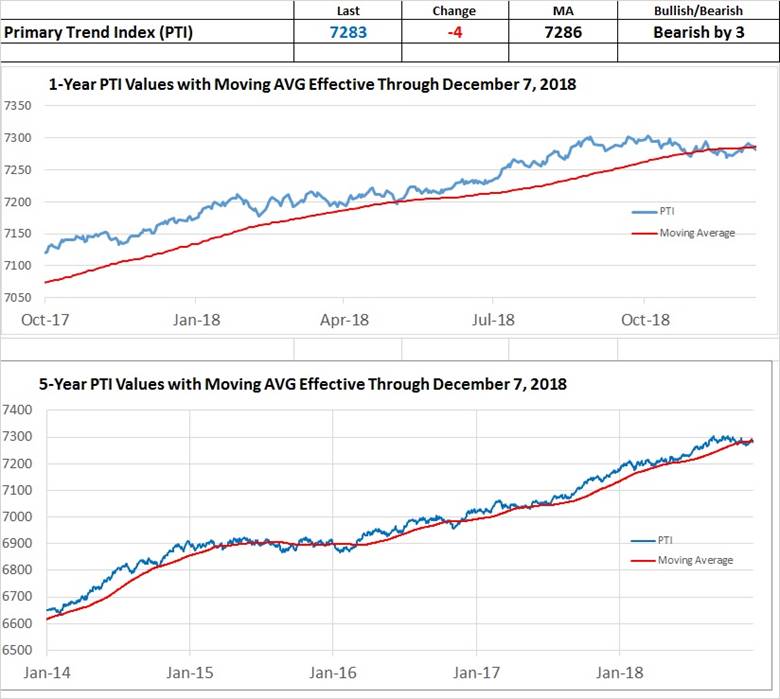
Russell stated that the PTI works best when it was
decisively above or below its 89-day moving average. When above that average, the primary trend is
up and a bull market rise is in force. Below the moving average is a sign of caution
that the bull market could be stalling out.
A sustained decline below the moving average signals the primary trend
is down and stocks are headed lower.
The first chart above show that the PTI just entered
the bearish zone on Friday December 7th (-4 on the day puts the PTI
bearish by 3). The second chart
indicates that the PTI is right at its moving average, which is neither bullish
or bearish.
3. According
to the latest Aden Forecast, the Dow
Transports (now at 9,951.16) must close below 9905 to confirm a Dow Theory sell
signal (both the Dow Industrials and Transports must close below their last
respective correction lows). The Aden
sisters state that “If the markets now stay below 7275 for NASDAQ, 10550 Dow
Transportations and 2715 on the S&P500, then stocks will be headed lower.”
Here are recent stock market index performance
numbers:
Dow
Industrials daily change:
Monday: Up 287.97 points.
Tuesday: Down 799.36 points.
Thursday: Down 79.4 points (after a much larger
intra-day decline).
Friday: Down 558.72 points. [Dow Jones Transports were DOWN a whopping
407.54 points or -3.93%]
For
the Week:
Dow industrials were down 1149.51 points or 4.5%.
[Dow Transports were down 869 points or -8.03%]
Nasdaq composite was down 361.29 points or 4.9%.
S&P 500 index was down 127.09 points or 4.6%.
Year
to Date:
Dow Industrials
9.5% down
from the high of 26,951.81 on 10/03/2018.
4.5% up from the low of 23,344.52 on
04/02/2018.
Nasdaq
14.3% down
from the high of 8,133.30 on 08/30/2018.
5.1% up
from the low of 6,630.67 on 02/09/2018.
S&P 500
10.5% down
from the high of 2,940.91 on 09/21/2018.
4.0% up
from the low of 2,532.69 on 02/09/2018.
4. Russell Investments' Doug Gordon
told
CNBC 's "Trading Nation" on Friday:
“The first and
fundamental question: Is this a
correction or is this the start of the bear market? While you can certainly see a path that could
get us to a bear market, I think it's more of a messy correction. We could go a
little deeper."
Mr. Gordon believes the correction will span about
two to four months, citing the end of the 90-day trade war cease-fire between
the U.S. and China as an important marker.
"The sources of risk right now are really exogenous, meaning
they're hard to forecast. They're risks obviously tied to trade restrictions
and the tariff escalation," he added.
5. Ned Davis Research’s Ed Clissold
suggests
this is not a normal stock market correction.
He believes U.S. stocks have already entered a bear market.
"If you take this as a typical bear market, not
associated with a recession, it's going to take you down around 20 percent —
maybe a little bit more," the firm's chief U.S. market strategist told
CNBC's "Futures Now" last week. "That's what we need to be
thinking about over the next several months."
Mr. Clissold tweeted on Wednesday: “Reset your
clocks. Tuesday was a 21:1 down day, negating the 11:1 up day on 11/28…” He later clarified that by replying to a
question from a Twitter follower: “Advancing volume/declining volume. The
volume of all stocks that were up on the day vs the volume of all stocks that
were down on the day.”
6. Finally, we
quote from the always enlightening Credit Strategist (December
9, 2018 edition), written by colleague Michael Lewitt:
We are most
likely entering a bear market. Real interest rates are still negative, but they
are approaching positive territory as measured by official government
statistics. That still leaves them negative in the real world, but markets
won’t see them that way. Further, as Raoul Pal convincingly argues in his
invaluable Global Macro Investor, financial conditions tightened significantly
over the last 24 months. The housing market is starting to look green around
the gills, something to watch out for in 2019. Highly leveraged corporations
(much more highly leveraged than a decade ago) will focus on their balance
sheets in the year ahead as higher rates start to bite (skyrocketing Libor is a
particular problem) – we are already seeing big
outflows from bank loan ETFs and new syndicated loans are struggling in the
market. A bear market will spell big trouble for the credit markets (and low
oil prices will hurt as well) and corporate bonds do not offer attractive
risk-adjusted returns and should be avoided – short-term Treasuries are much
more attractive now. It has been a great time for idiots, but the time for
idiots is over. You better make sure you have someone smart managing your money
or you will have less of it when the smoke clears. From now on, thinking is
required.
As for recommendations, Michael writes: “I offer very
few long recommendations because I expect the market to drop double digits in
2019 and if that happens few stocks will do well.”
Curmudgeon
Comments:
We are actually very surprised by the timing of the
current stock market decline, which is happening at the most favorable
(BULLISH) seasonality of the year- from December 1st to January 10th.
We’ve twice written
that the period following U.S. mid-term elections has been extremely bullish.
Once again:
“Leuthold Group found that since 1942, the mid-term
election year’s six-month window,
beginning in November of the mid-term year and extending through April of the
pre-election year, has seen an average un-annualized S&P 500 total return
of +17.2%. Indeed, none of the 19 six-month windows in this study saw a
total return LOSS. That’s impressive!”
Expect a lot more rhetoric and outcries for the Fed
NOT to raise short term interest rates in 2019 after their expected December
2018 25 bps hike in the Fed Funds rate.
That might put a temporary floor under the market and stimulate a rally
which is likely to fail to make new all-time highs. For those so inclined, that would be a great
short selling opportunity!
Closing Points
to Ponder from Michael Lewitt:
Our colleague reminds readers that bear markets destroy
the profits gained during bull markets and cites FAANG stocks as examples.
In the December 2018 Credit Strategist, he notes that stocks are not as cheap as they
look:
“While the so-called forward earnings multiple on the
S&P 500 dropped to around 15x in November, this earnings number is inflated
by bogus non-GAAP adjustments that inflate them by 20-30%. The real forward
multiple is closer to 20x and renders stocks far from cheap by any measure. But
valuations don’t seem to matter much to investors these days since they remain
stunningly ignorant about what they own in their ETFs and other passive
strategies that relieve them of the trouble of thinking. The market was led by
FAANGs which rose by $1 trillion and fell by $1 trillion while the financial
media cheered and then wept. Earnings peaked in 2Q and 3Q18. Whatever is going
on in the market, it is no longer investing. And it ends in tears.”
………………………………………………………………………………………………………………………………
Good luck and till next time…
The Curmudgeon
ajwdct@gmail.com
Follow
the Curmudgeon on Twitter @ajwdct247
Curmudgeon is a retired investment professional. He has
been involved in financial markets since 1968 (yes, he cut his teeth on the
1968-1974 bear market), became an SEC Registered Investment Advisor in 1995,
and received the Chartered Financial Analyst designation from AIMR (now CFA
Institute) in 1996. He managed hedged equity and alternative
(non-correlated) investment accounts for clients from 1992-2005.
Victor Sperandeo is a
historian, economist and financial innovator who has re-invented himself and
the companies he's owned (since 1971) to profit in the ever changing and arcane
world of markets, economies and government policies. Victor started his Wall Street career in 1966
and began trading for a living in 1968. As President and CEO of Alpha Financial
Technologies LLC, Sperandeo oversees the firm's research and development
platform, which is used to create innovative solutions for different futures
markets, risk parameters and other factors.
Copyright © 2018 by the
Curmudgeon and Marc Sexton. All rights reserved.
Readers are PROHIBITED from
duplicating, copying, or reproducing article(s) written
by The Curmudgeon and Victor Sperandeo without providing the URL of the
original posted article(s).