Russell
2000 Breaks Out to All Time High With a 15-Day Winning Streak
by the Curmudgeon
Overview:
The Curmudgeon has been
especially perplexed and bewildered by the Russell 2000 Index of 1989 small cap
stocks (ETF symbol IWM).
We stated in our most recent post that the
Russell 2000 was up 15 consecutive trading days through last Friday, November
25th, with a gain of 16.5% during that time. It was the index’s best-ever performance in
winning streaks that stretched 15 days or longer, according to Bespoke
Investment Group. The last 15-day
winning streak for the small cap index was over 20 years ago – it ended on Feb.
6, 1996. But there was only a 6.1% gain,
which was about 1/3 that of the recent up move in the index.
In recent blog posts, I’ve
stated what no one else has talked or written about: that the Russell 2000 52-week trailing P/E =
“nil” (source: WSJ) or “N/A” (source: Yahoo Finance). That’s because the composite earnings of the
1989 companies in the index was negligible, zero or negative (we don’t know
which).
Trailing P/E=nil arguably
demonstrates that the stock market is NOT a discounting mechanism! Here’s why:
One year ago, forward earnings estimate for the Russell 2000 was 20 vs.
a then trailing P/E of 146. In other
words, the market was expecting much better earnings for the small cap index,
but the actual earnings were much worse than they were in the previous year
(when the trailing P/E was a sky high 146).
Despite have no earnings, the Russell 2000 index has rallied strongly
since February 11th even though the earnings forecast was dead
wrong!
The Russell 2000’s breakout
advance is clearly depicted in the charts below, courtesy of Dow Theory
Letters.
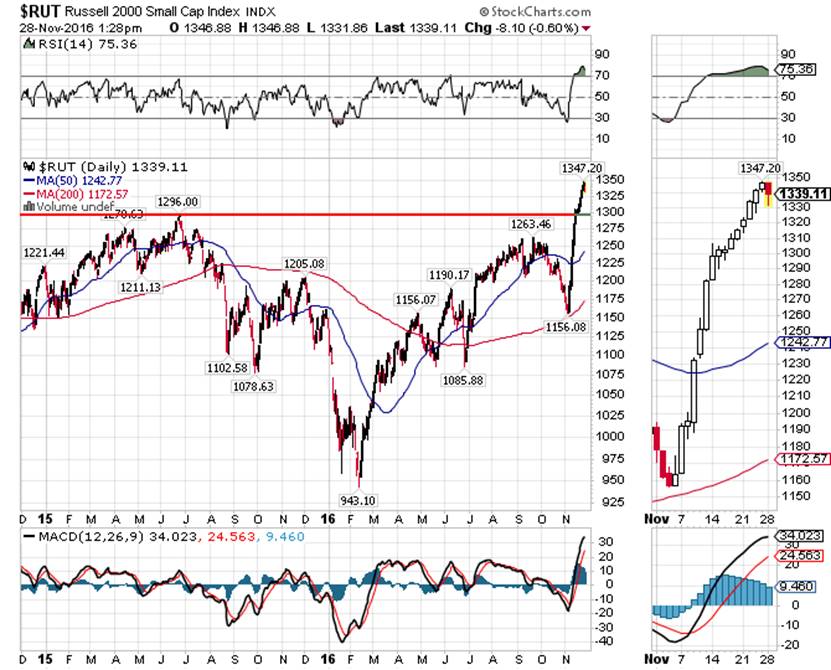
The zoomed-in chart on the
right side (above) shows the remarkable 15-day winning streak that propelled
the index to new all-time highs. It
ended on Monday November 28th and the index was down very slightly
today (November 29th).
Dow Theory Letters Perspective on the Russell 2000:
Matthew Kerkhoff
of Dow Theory Letters (subscription required) wrote yesterday:
The
Russell 2000 has been rallying for a variety of reasons, mostly tied to Trump’s
economic plan. If regulations are relaxed, taxes are lowered and money is
dumped into infrastructure projects, the small caps stand to benefit more than
their larger brethren. These small cap firms are better positioned to benefit
from stimulus spending, and often pay a higher effective tax rate than
multinational companies. The strong weighting towards financial and bank stocks
has also helped the Russell 2000 rally as financial stocks have been a pocket
of strength.
Does that bullish forecast
negate that collectively, the companies in the index have no earnings? Or since the market supposedly also looks 12
months out, should you pay attention to the forward P/E estimate of 19.55 from Birinyi Associates via WSJ’s Market and Data Center?
What’s Next?
The late Paul Montgomery of
Legg Mason said that consecutive closing streaks in stocks or stock indexes,
much like gaps, were not randomly distributed. They occur either at the start,
direct mid-point or the end of a market move. The Russell 2000 has been
rallying since Feb 11th, so its 15 consecutive-closing higher streak
is not the start of a new move as so many pundits have labeled it.
Looking at the aforementioned
1996 winning streak, the small cap index ran up another 2.5% to a record close
one month after the streak was snapped, and another 8.2% three months after the
streak ended. A year later, the Russell 2000 was up 15%.
A week after the four prior
winning streaks of 15 days or more since 1979 (the record was 19 trading days
in 1985) the Russell 2000 was up 1%, on average. A month later it was up 2.4%
and higher all four times. After a small consolidation three months out, which
saw gains of just 0.9%, the Russell 2000 was up solidly six months later, with
average gains of 6.3%.
Regarding favorable seasonality
next month, Jeff Hirsch of Almanac Trader wrote:
Over
the most recent 21-year period, December has developed a pattern of opening
with strength lasting until about the third day for DJIA, S&P 500 and
Russell 1000 (NASDAQ and Russell 2000 tend to run a bit higher into the sixth
or seventh trading day) before moving sideways and finally lower into mid-month
giving back any gains and then some by the eleventh trading day. From there,
the major indices generally consolidate until the fourteenth or fifteenth
trading day before rallying to close out December.
Conclusions:
Stock market history suggests
that long streaks of price gains tend to keep going. That’s true even if the gains are based on
unrealistic expectations. There are
also bullish confirmations among the other main stock market indexes and no
technical negatives. However, it is very
late in this 7.75-year bull market, valuations are extremely high, the post-election
advance is fueled by expectations of economic growth and profits that may not
be realized. Extreme caution is advised
in establishing or adding to US equity positions.
Good luck and till next time...
The
Curmudgeon
ajwdct@sbumail.com
Follow the
Curmudgeon on Twitter @ajwdct247
Curmudgeon is a retired investment professional. He has
been involved in financial markets since 1968 (yes, he cut his teeth on the
1968-1974 bear market), became an SEC Registered Investment Advisor in 1995,
and received the Chartered Financial Analyst designation from AIMR (now CFA
Institute) in 1996. He managed hedged equity and alternative
(non-correlated) investment accounts for clients from 1992-2005.
Victor Sperandeo is a
historian, economist and financial innovator who has re-invented himself and
the companies he's owned (since 1971) to profit in the ever changing and arcane
world of markets, economies and government policies. Victor started his Wall Street career in 1966
and began trading for a living in 1968. As President and CEO of Alpha Financial
Technologies LLC, Sperandeo oversees the firm's research and development
platform, which is used to create innovative solutions for different futures
markets, risk parameters and other factors.
Copyright © 2016 by the
Curmudgeon and Marc Sexton. All rights reserved.
Readers are PROHIBITED from
duplicating, copying, or reproducing article(s) written
by The Curmudgeon and Victor Sperandeo without providing the URL of the
original posted article(s).