U.S. Economy Continues to Show Cracks While Fed Pushes
on a String!
by The Curmudgeon
The U.S.
economic weakness described in previous CURMUDGEON posts has continued, as per
these recent news releases:
·
The
University of Michigan-Thomson Reuters consumer-sentiment gauge dropped
to a preliminary April reading of 72.3 — the lowest result since July 2013 —
from a final March reading of 78.6.
Economists polled by MarketWatch had expected a preliminary April
reading of 79.3.
·
U.S.
Commerce Dept. reported Friday that sales at U.S. retailers fell 0.4 percent
last month, indicating that higher payroll taxes and weak hiring likely
made some consumers more cautious about spending. With increase in the payroll tax (on January
1st), rising health and food costs, sequestration (automatic federal government
spending cuts, as of March 1st), and an uncertain employment picture, consumers
are not likely to increase spending.
·
Restocking
of goods slowed last month, according to the Commerce Dept. which said
that business inventories edged up 0.1% in February to a seasonally adjusted
$1.64 trillion. That came in below the
0.4% forecast in a MarketWatch-compiled economist poll. Meanwhile, January's growth was revised to
0.9% from an initially estimated 1%.
·
The March
NFIB Index of Small Business Optimism ended its slow climb, declining
1.3 points to 89.5. In the 44 months of economic expansion
since the beginning of the recovery in July 2009, the Index has averaged 90.7,
putting the March reading below the mean for this period.
·
Institute
for Supply Management™ Manufacturing Index (PMI) registered 51.3 percent, a decrease
of 2.9 percentage points from February's reading of 54.2 percent,
indicating expansion in manufacturing sector is slowing.
·
Institute
for Supply Management™ Non-Manufacturing Index (NMI) registered 54.4 percent in
March, 1.6 percentage points lower than the 56 percent registered in
February.
·
Index
of Manufacturers' New Orders: Nondefense Capital Goods Excluding Aircraft decreased
to 67593 in February (latest month reported) from 65405 in January. By excluding military/government spending,
it's a good indicator of the private sector economy.
But the U.S.
economy is actually in worse shape than the above indicators suggest! Here's why:
1.
The
effects of the federal government’s budget sequestration — $85 billion in
automatic spending cuts — are just beginning to be felt on consumer and capital
spending, economic growth or unemployment.
For sure, sequestration is not going to help the economy grow or add
jobs.
2.
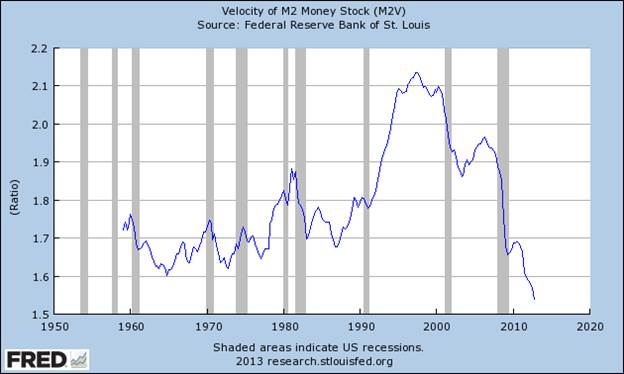
Another
disturbing trend during this "economic recovery" is the precipitous
decline in the velocity of money (which measures how fast money changes
hands or turns over). The faster that
happens, the more positive effect on economic activity. But when money velocity declines sharply,
even as supply (e.g. M1, M2) is soaring, it means that the added liquidity is
not stimulating economic activity.
The graph
below of Velocity of M2 Money Stock (M2V) below is as scary as it gets.
Combined with the exponential growth in M2, the Fed's Balance Sheet, and the
Monetary Base (shown in a previous CURMUDGEON post) it
proves that the Fed has been "pushing on a string" with its zero
interest rate policy and QE programs- at least as far as the real economy is
concerned.
3.
It
appears the Fed's newly created money seems to be finding its way into
financial markets, especially the U.S. stocks market. Yet, there is absolutely no evidence to
support the assertion that higher stock prices meaningfully support economic
expansion. "Historically, a 1.0% increase in the S&P 500 index has
been accompanied by GDP growth of approximately 0.04%n during the same year,
0.04% growth during the next year, and it has a negative correlation during
subsequent years," writes
Erik McCurdy, senior market technician for Prometheus Market Insight.
The final two
charts below paint a picture of a deteriorating U.S. economy. The 1st chart
shows the steady drop in new orders since the "economic
recovery" began in June 2009. The
index has dropped from 63.8 in April 2011 to its most recent March 2013 reading
of 51.4 (down from 57.8 in February).
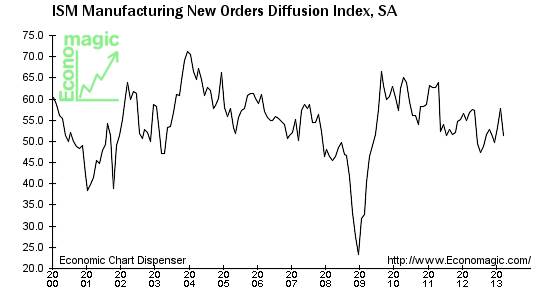
Without new
orders, production won't increase and the economy won't grow. Some say, it's a "service economy."
But services depend on real things
that must be ordered and produced before they can be serviced!
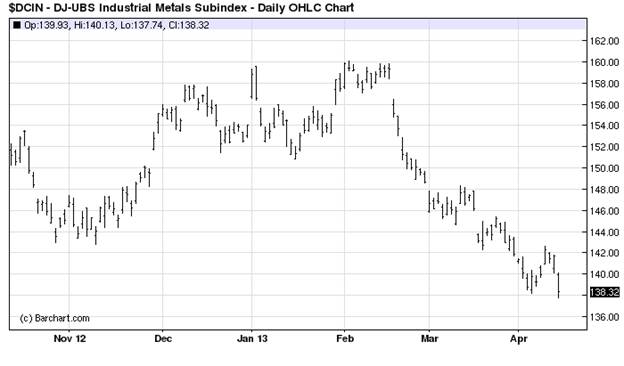
The steep downtrend
in the DJ-UBS Industrial Metals sub-index is shown in the chart below.
It indicates reduced demand for industrial metals used in manufacturing of real
things!
Conclusions:
With all these
negative economic indicators and sharp drop in money velocity, the real economy
will be lucky to limp along at a 1.5% growth rate with unemployment staying
high and more people quitting the labor force.
Summing up,
Joseph Carson director of global economic research at AllianceBernstein
recently said. “Prices of financial assets have been rising rapidly. Wages have
not. Job creation has not. People in less exalted income brackets are still
struggling."
And that cold
reality makes the "great disconnect" between sharply rising stock
prices and the stagnant real economy even more striking!
Till next time.....................................
The Curmudgeon
Curmudgeon is a retired investment professional. He has been involved in financial markets since 1968 (yes, he cut his teeth on the 1968-1974 bear market), became an SEC Registered Investment Advisor in 1995, and received the Chartered Financial Analyst designation from AIMR (now CFA Institute) in 1996. He managed hedged equity and alternative (non-correlated) investment accounts for clients from 1992-2005.