Defensive Stocks Decline; Small Caps Underperform
By the
Curmudgeon with Victor Sperandeo
Introduction:
Despite wobbling for the past three months, 2023 has been a
stellar year for most U.S. stock indexes and sectors. The S&P 500 total return is + 14.2% YTD,
the NASDAQ Composite is +26.9%, and the NASDAQ 100 is +30%. But not all stock sectors have done nearly
that well.
Selling pressure in some defensive stocks has been
incredibly strong. Recession resistant
defensive sectors like Utilities, Health Care, and Consumer Staples have
been hit hard in 2023.
Utilities are usually
considered among the safest bets in the stock market, suitable for “widows and
orphans,” and offer some of the highest dividends. Nonetheless, they have
declined ~ -15% this year, the worst-performing sector in the S&P 500
index.
Separately, small cap stocks have continued to underperform
large caps and that trend is likely to continue.
Victor concludes with a review of asset class performance
from the end of 2021 to date. The
results will be a surprise to most Curmudgeon readers. It was a surprise to me!
Defensive Stocks Unexpectedly Decline in 2023:
Utilities (electric, energy,
water) have been the weakest stock sector this year. After hitting a 52-week
low of $54.93 on October 3rd, the XLU Utilities Select Sector
SPDR ETF [1.] closed Friday at $59.30 +1.13% for the day, but its
YTD total return is -13.9%.
Note 1. The XLU tracks a
market-cap-weighted index of U.S. utilities stocks drawn exclusively from the
S&P 500. This ETF dominates the
utility sector, with huge assets and volume.
The Dow Jones Utility Average (DJU), with only 15
companies included, has also bounced off its October 2nd low, but
has lost -14.77% YTD in 2023.
Telecom stocks (not
included in the XLU or DJU) have had a horrible year - even worse than
utilities.
l The Dow Jones U.S. Telecommunications Index is -17.34%
YTD.
l Despite an 8.67% dividend, Verizon (VZ) stock is -16.39% YTD.
l AT&T (T)
stock has performed slightly worse with a -16.74% YTD total return.
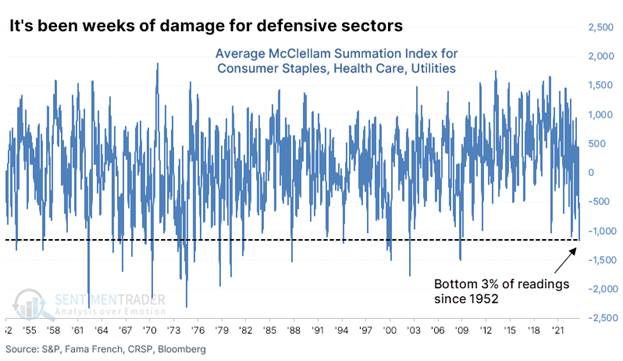
Sentimentrader averaged the McClellan Summation Indexes for the
three defensive sectors. As per the chart below, we see that it has declined to
one of the lowest levels in 70 years. It's now in the bottom 3% of all days
since 1952!
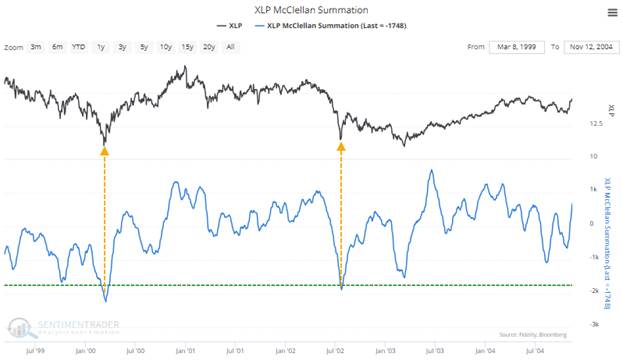
The McClellan
Summation Index for Consumer Staples neared -1700 for one of the few times in
25 years.
The only two distinct occurrences were during the last two
significant bear markets.
The following chart shows that a reading below -1500 ranks in
the bottom 1.5% of all days in the past 70 years.
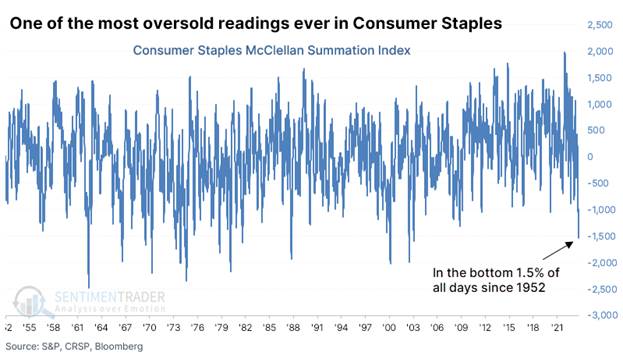
The difference in data sets is primarily due to a slight
difference in the number of stocks in the sector that advanced or declined
daily. Minor differences in daily figures can have an outsized impact on longer-term
cumulative indicators like the Summation Index.
Even lesser extremes than we see now have preceded some
further short-term weakness but medium- to long-term strength in the sector.
….……………………………………………………………………………………….
Small Stocks Continue to Lag:
This is one of the worst years in nearly a hundred for Small
Cap stocks relative to Large Caps, based on their total returns through Friday.
With Small Caps underperforming by more than -13%, the spread is the 8th-worst
out of the last 95 years.
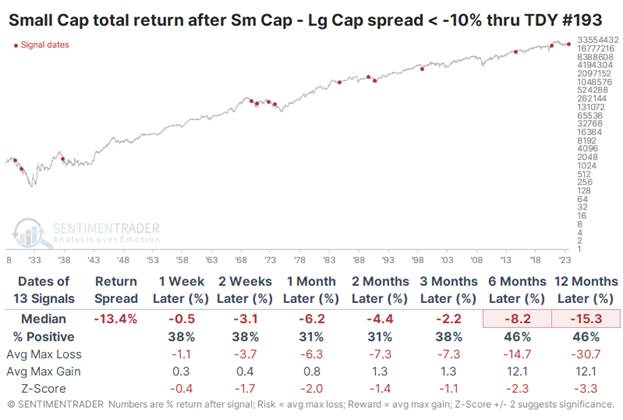
The relative ratio between the two shows that smaller stocks
had a strong tendency to continue to underperform. Even up to a year later,
small stocks outperformed only 23% of the time, though once again the worst
signals were concentrated in earlier decades.
Investors are fleeing small caps despite their low historical
valuation. The forward P/E of the S&P 600 U.S. Small Cap Index is well
below its historical average as shown in this chart:
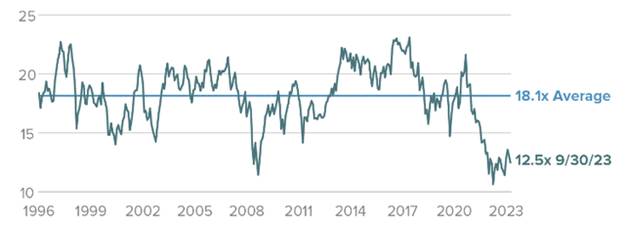
Small-Cap Index (Current P/E)
According to Yardeni Research, as
of October 13th that index’s P/E is only 11.9 (vs. 18.0 for the
S&P 500 Large Cap Index).
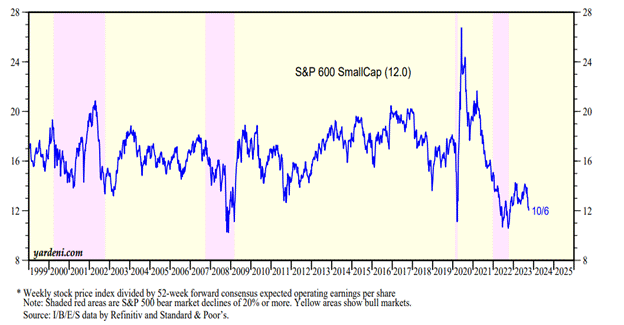
Source: S&P Global
….………………………………………………………………………………………….
Victor’s Comments:
The U.S. stock market is focused on whether
or not the Fed is done raising rates.
Will there be one more at the November 1st or December 14th
FOMC meeting?
Most advisors and analysts are looking for the Fed to pivot
in 2024 to lower rates as a recession hits “sometime soon.” I have a different take on this as I’ve previously stated in
this post:
To recap, a recession will be avoided “at all costs” in 2024
because it’s a Presidential election year. As a result, there will be no cuts
in U.S. government spending and inflation will continue unabated. I believe the Fed and U.S. government
secretly want higher inflation so that the national debt is repaid in “cheaper”
U.S. dollars.
For now, there is some confusion on what various assets have
done. All returns are relative to the environment you’re in.
Let’s review the performance of various asset classes from
the end of 2021 (12/31/21- 10/13/23). I
use ETFs where possible, as they are the preferred investment vehicle of
investors:
l Small Caps (Russell 2000) using IWM -23.2%
l Dow Jones Industrials (DJI) -7.4%
l S&P 500 using SPY -9.2%
l NASDAQ 100 using QQQ -12.57%
l GOLD using GLD +4.6%
l SILVER using SLV +.01%
l Dollar Index using UUP +16.78% (DXY Index is +10.61%).
l Intermediate U.S. Government Notes using IEI -12.2%
l 20+ Year U.S. Bonds using TLT -40.99%
l Treasury Inflation Protection Securities using TIP -19.8%
l CRB COMMODITY INDEX +22.2%
l CRUDE OIL using XLE +59.6%
l BITCOIN ”PRICE”
-41.9%
Clearly, Oil, Commodities, Gold, and the U.S. Dollar were in
the green while Debt was far in the red. The CRB is heavily weighted to the
positive energy complex returns. Despite double digit gains in 2023, U.S. stock
indexes are still down by various amounts.
Next year if the Dollar declines, Gold, and Silver should be
up substantially. Oil should also do well if a recession is avoided.
-->I will provide my 2024 forecast after the Fed’s
November FOMC meeting.
End Quote:
”Inflation is
legal counterfeiting; Counterfeiting is criminal inflation.” Tweet by Robert Breedlove (a Bitcoin-focused entrepreneur, writer, and philosopher)
Be well, success, good luck and till next time………………
The Curmudgeon
ajwdct@gmail.com
Follow the Curmudgeon on Twitter @ajwdct247
Curmudgeon is a retired investment professional. He has been involved in financial markets since 1968 (yes, he cut his teeth on the 1968-1974 bear market), became an SEC Registered Investment Advisor in 1995, and received the Chartered Financial Analyst designation from AIMR (now CFA Institute) in 1996. He managed hedged equity and alternative (non-correlated) investment accounts for clients from 1992-2005.
Victor Sperandeo is a historian, economist and financial innovator who has re-invented himself and the companies he's owned (since 1971) to profit in the ever changing and arcane world of markets, economies, and government policies. Victor started his Wall Street career in 1966 and began trading for a living in 1968. As President and CEO of Alpha Financial Technologies LLC, Sperandeo oversees the firm's research and development platform, which is used to create innovative solutions for different futures markets, risk parameters and other factors.
Copyright © 2023 by the Curmudgeon and Marc Sexton. All rights reserved.
Readers are PROHIBITED from duplicating, copying, or reproducing article(s) written by The Curmudgeon and Victor Sperandeo without providing the URL of the original posted article(s).