Behind the Numbers of Last Week’s Big Economic Reports
by the Curmudgeon with Victor Sperandeo
Introduction:
We review and analyze the important economic reports of the past week. Revealing contrary opinion on jobs and real disposable income is then referenced. Victor concludes with his "behind the numbers" take on the week's important economic events and their impact on the markets.
Analysis of Last Week's U.S. Economic Reports:
Don't trust government released economic numbers! For a very long time, we've said not to believe the accuracy of important U.S. government issued economic reports, especially the initial estimates. Last Thursday's "advanced estimate" of second quarter GDP being up 4% is the latest example of fudging the numbers -- this time by the Bureau of Economic Analysis (BEA), which issued the referenced GDP report.
What most people ignored is that this "estimate" (we think it's more of a "guestimate") is subject to revision which may be quite large. The BEA emphasized that the "advanced estimate" is based on source data that are incomplete or subject to further revision by the source agency. The "second" estimate for the second quarter, based on more complete data, will be released on August 28, 2014.
The BEA also revised the first quarter GDP to be down only -2.1% from the previously reported -2.9%. The second quarter GDP estimate was largest positive quarter to quarter improvement in GDP growth in 14 years.
BEA reported that the increase in real GDP in the second quarter primarily reflected positive contributions from personal consumption expenditures (PCE), private inventory investment, exports, nonresidential fixed investment, state and local government spending, and residential fixed investment. Imports (which are a subtraction in the calculation of GDP) increased, which would normally result in a lower GDP number.
Several economists believe that the BEA made overly optimistic estimates for many metrics, including: inventory building, auto sales, construction spending, economic impact of the Affordable Care Act (which we think is decidedly negative), near-term performance of the trade deficit and swings in consumer gas and electric usage related to unseasonable weather patterns.
In particular, 1.6% of that 4% GDP growth was due to inventory building. Periods of strong inventory building are usually followed by a decline in activity in subsequent periods as that inventory is worked off. That tends to decrease GDP.
Here's what ShadowStats John Williams had to say about the second quarter GDP report:
·
Second-Quarter GDP Surge Not Credible
·
Significant Downside Revisions Remain in Offing
·
Actual Economic Activity Remains in Serious
Trouble
·
Historical GDP Revised Lower Where Better Data
Were Available
· Historical GDP Revised Higher Where Better Numbers Were Not
John (and other economists) believe that the August 6th estimate of the June trade deficit is likely to cause a downside revision of second quarter GDP. (The June trade balance is expected to remain mostly unchanged at a deficit of $45.0 billion, slightly wider than the $44.4 billion May deficit, according to an MNI survey.)
This Friday's BLS Employment Situation report
and BEA's Personal
Income & Outlays report did not confirm the strong second quarter GDP
"estimate."
The U.S. economy added 209,000 jobs in July which was not nearly as strong as in June, when non-farm payrolls increased by 298,000 (revised up from an earlier estimate of 288,000; while May's gain was revised up to 229,000 from 224,000). The unemployment rate ticked up to a seasonally adjusted 6.2% in July from 6.1% in June. Economists surveyed by MarketWatch had forecast that payrolls would to rise by a more robust 235,000 in July and the jobless rate would inch down to 6.0%.
Almost all of the jobs growth in July came from the private services sector, with business services adding 47,000 positions. Healthcare and the leisure sector remained flat (from June). Construction added 22,000 jobs in June while manufacturing added 28,000.
The U.S. economy has created an average of 230,000 jobs per month this year. Indeed, that's progress! Last year the economy created only 194,000 jobs per month. However, we submit that most of the jobs added this year were part time or low paying jobs (much of that due to companies not wanting to hire full time workers due to mandatory ACA premiums they'd have to pay). Please see the Contrary Opinion section of this post for more on this important topic.
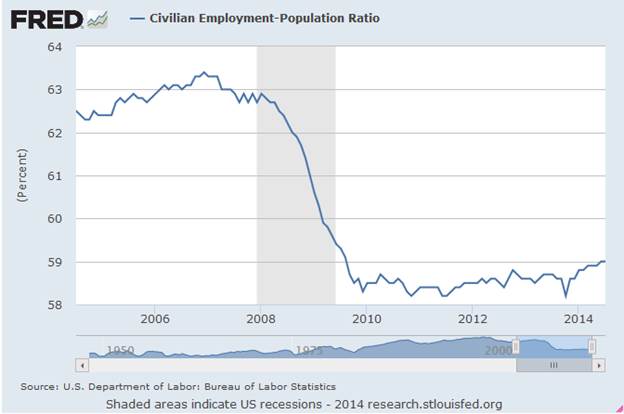
There were more troubling statistics hidden in the jobs report. Surprisingly, only 59% of Americans have a job. According to the BLS:
"The employment-population ratio, at 59.0 percent, was unchanged over the month but has edged up by 0.3 percentage point over the past 12 months." The St. Louis Fed chart below shows how little progress has been made in the employment-population ratio since the recession "ended" in June 2009.
The Hamilton Project, a Washington group affiliated with the Brookings Institution, calculated that the economy had a “jobs gap” at the end of July of 5.7 million jobs. That's the number needed to return to prerecession employment levels while absorbing the people who enter the labor force each month.
The Employment Cost Index (ECI) for civilian workers increased 0.7%, seasonally adjusted, for the 3-month period ending June 2014. That's a decent second quarter gain, but its pace of improvement would have been thought mediocre at best during any solid economic recovery. At a year-over-year gain of 2%, the ECI increase is exactly the same as the annual rise in average hourly earnings noted in Friday’s Employment report.
“Despite no change in average hourly earnings in July, the rise in payrolls should be enough to generate a further rise in income,” said Paul Dales, senior U.S. economist at Capital Economics. “This will allow consumption growth to rise in the second half of the year,” he added.
At the conclusion of its FOMC meeting this week, the Fed said that U.S. labor resources were being "under-utilized" and there was more capacity for improvement in job creation. That was a revision to its previous position that the unemployment rate was “elevated.” That spare capacity in labor (the labor participation rate hovers at 33 year lows) will likely cause the Fed to wait for more progress in the jobs market before it raises short term interest rates, especially with SuperDove Janet Yellen as Fed head.
One very positive economic report this week was the Conference Board’s Consumer Confidence index, which rose to 90.9 in July, the highest since October 2007. That's up from a revised 86.4 in June, according to the New York-based private research group. The Present Situation Index increased to 88.3 from 86.3, while the Expectations Index rose to 92.7 from 86.4 in June. However, the University of Michigan index of consumer sentiment edged down to 81.8 in July from 82.3 in June. The index of consumers' assessment of current conditions rose but the index for expectations dipped slightly from the June reading. Which consumer confidence survey should we believe?
Contrary
Opinion on U.S. Employment Reports: What Recovery?
Alhambra
Investment Partners wrote
in a blog
post about the
discrepancy between the U.S. Establishment and Household
employment surveys, while calling attention to a stagnant labor force that
hasn't grown in the last two years.
"The Household
Survey continues to undercount (or more accurately count, depending on your
view of the collective data pulse) the trajectory of jobs, numbering only
69% of what the Establishment Survey figures since the divergence
began about 21 months ago."
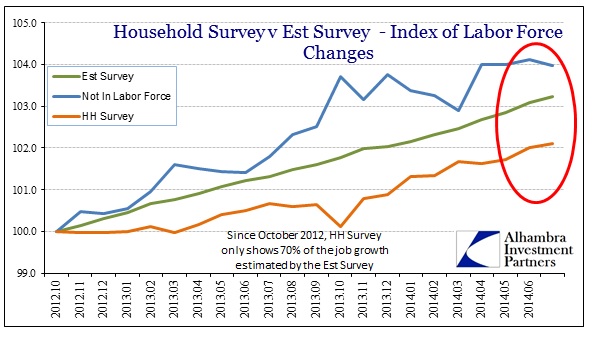
Chart Courtesy of Alhambra Investment Partners
"And
despite all these payroll gains, for some reason the labor force (growth
rate) has been stuck at zero for almost two years. It needs to be said
every month, but a rising, to the point of robustness as it has been told, job
market would bring in new entrants at a rapid rate where the unemployment rate
would rise (for more than one month) significantly for some time. That is
especially true given that there are millions of former labor force
participants still willing to work but haven given up on it – thus shunned by
the official measures."
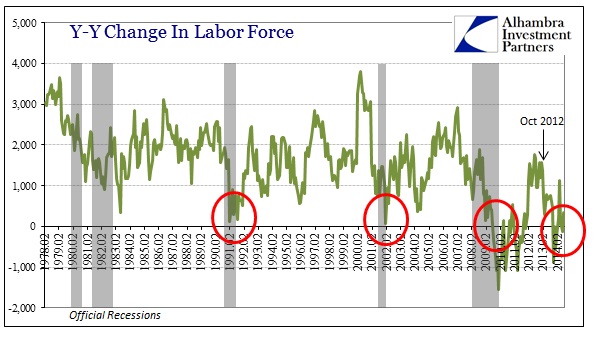
Chart Courtesy of Alhambra Investment Partners
"There are
no realistic scenarios where the job market is expanding greatly into a
self-sustaining recovery that would simultaneously leave out and behind so much
of this labor “slack.” The only plausible scenario is one in which all these
purported new jobs are mostly unappealing, meaning paying little and offering
even less by way of future prospects, and thus emblematic not of a return to
economic health but continued redistribution via asset inflation."
Meager
Growth in U.S. Real Disposable Income Per Capita:
Real annualized
per-capita disposable income was reported to be $37,449 -- up some $284 from
the prior quarter (a 3.1% annualized growth rate) but still down $420 from the
fourth quarter of 2012. A significant portion of that increased disposable
income went into savings, with the savings rate growing to 5.3% -- the highest
savings level since 4th Quarter-2012.
In a fascinating analysis
of nominal vs real (inflation adjusted) per capita disposable income since
January 2000, Phil Short of Phil's Stock World concludes: "Nominal disposable income is up 59.9%
since then (Jan 2000). But the real purchasing power of those dollars is up
only 20.5%." That's only 1.36% real
disposable income annual growth averaged over the last fifteen years!
Moreover, Mr. Short's charts clearly show that all
measures of real disposable income per capita are significantly below
their December 2012 intermediate high.
We think there are two prime reasons for this meager income growth: zero interest rates that severely penalize savers and very low growth in wages (except for the higher priced help like CEOs, investment bankers, hedge fund managers, etc.).
Victor's Comments:
The GDP headline
number on Thursday was initially seen as “good news" by the markets, but
faded into a small up day for stocks, and a small down day for bonds and
gold. On Friday, Non-Farm
payrolls/employment numbers for July disappointed market participants, as
payrolls were less than expected while unemployment ticked up to 6.2% from 6.1%
in June.
However, the
real selling came in when the "Employment Cost index" was
reported to be up 0.7%. That increase
was seen as important, because the Fed is generally concerned with wage
inflation -- more so than with commodity price increases. Wages are sticky and seldom decline, while
commodity price inflation fluctuates greatly and is considered cyclical. With
inflation and wages both rising at the Fed's target of 2% and the stock market
at an all-time high, "investors" were nervous about the Fed raising
rates sooner than projected -- in July of 2015.
Commodities
reacted to these events in a material way.
I keep a "short term" trend index of 39 commodity, currency,
and debt futures. On July 1st, 24 were
long, four were neutral, and 11 were short.
On July 31st, eight were long, four neutral, and 27 were short. The message of those markets is the U.S. is
experiencing modest economic growth (to be revised lower?) with inflation at
the Fed's target of 2%. That implies
higher short term rates sooner than expected.
Stocks, as
measured by the S&P 500, were down 3.16% from the all-time high of July
24th. The Russell 2000 is down 7.55% from its July 1st high and is down 4.19%
YTD.
In this case,
good news (on the economy) is bad news (for the markets), as Central Banks are
the key driver of stocks, bonds, real estate, and auto sales around the
world. A change in interest rate policy
(especially by the Fed) will likely cause havoc in those markets.
For the record,
the monetary stimulus started September 18, 2007 when the first Fed Funds rate
cut of 50 bps (from 5.25%) took place.
There were nine more cuts till December 18, 2008, when Fed Funds reached
zero (actually 0 to 0.25%). It hasn't
budged since then.
Meanwhile,
gross debt was $ 9.009 trillion on September 18, 2007. On July 24, 2014 gross debt is at $17.613
trillion (+ 95.5%). That's a 10.9%
compounded annual rate! Worse, the Fed's
balance sheet is heading to 26.5% of GDP.
Yet seasonally adjusted GDP has increased a mere 0.90 bps annually
[Source: Alhambra Partners) from the 4th
quarter of 2007].
This begs the
question -- with this entire stimulus why was GDP growth so meager? Reason: few people are borrowing (Excess Bank
Reserves, at $2.6 trillion are at record levels) and money is not turning over
(as shown in M2’s velocity of 1.53). I
firmly believe that the change in U.S. borrowing and spending patterns during
the last 5.5 years is what I've referred to as "a trend towards
Socialism." For example, the ACA, whose laws are being rewritten every
month and Dodd/Frank whose laws are half written and incredibly, the banks are
still "too big to fail."
The issue of
poor economic results accompanied by questionable data is ideology which is
trumping "we the people." In
this administration, issues like the ACA, global warming (raise taxes on
energy), and now immigration "amnesty” seem to be more important than
growing the economy and creating decent jobs.
I'm concerned
that America will not be back to what it was.
All aspects of the economy are likely to be below historically normal
levels till major changes occur in our political representatives’ view of what
kind of society we wish to be?
Never since the
end of World War II has our system of economic freedom been so threatened. Despite 5.6 years of zero interest rates, the
U.S. has experienced an unimaginable outcome of economic weakness with many
people struggling to make ends meet.
How can one trust
the economic numbers reported by the U.S. the government when our officials continue
to lie to Congress? CIA Director John
Brennan just admitted to lying during his March 11th testimony, as his agency
was spying on the Senate Committee that oversees the CIA. Why wasn't he fired for that? Obama still backs him! Now add that to the lies of the head of the
DOJ, IRS, and Director of National Intelligence (James Clapper). With the heads of state lying under oath and
Obama getting his ACA passed...do you really want to believe heads of the BEA
or BLS and the numbers they put out?
Till next
time........................
The Curmudgeon
ajwdct@sbumail.com
Curmudgeon is a retired investment professional. He has been involved in financial markets since 1968 (yes, he cut his teeth on the 1968-1974 bear market), became an SEC Registered Investment Advisor in 1995, and received the Chartered Financial Analyst designation from AIMR (now CFA Institute) in 1996. He managed hedged equity and alternative (non-correlated) investment accounts for clients from 1992-2005.
Victor Sperandeo is a
historian, economist and financial innovator who has re-invented himself and
the companies he's owned (since 1971) to profit in the ever changing and arcane
world of markets, economies and government policies. Victor started his Wall Street career in 1966
and began trading for a living in 1968. As President and CEO of Alpha Financial
Technologies LLC, Sperandeo oversees the firm's research and development
platform, which is used to create innovative solutions for different futures
markets, risk parameters and other factors.
Copyright © 2014 by The Curmudgeon and Marc Sexton. All rights reserved.
Readers are PROHIBITED from duplicating, copying, or reproducing
article(s) written by The Curmudgeon and Victor Sperandeo without providing the
url of the original posted
article(s).