Divergences Galore in U.S. Equity vs. Credit Markets
By the
Curmudgeon
Introduction:
With the possible
exception of
March to October 1987, we have never seen so many divergences between U.S.
equities and U.S. bonds. The latter has
been in a major bear market since June 2020 while the S&P and other popular
stock market indexes have been in a sustained bull market (without a 10%
correction) since the lows on October 12, 2022.
P/E Expansion Drives
S&P 500 YoY Total Return:
The primary driver behind
the resurgence in U.S. equities since the Oct 2022 lows has been P/E ratio
expansion. That usually occurs ONLY when
earnings growth accelerates OR interest rates decline substantially. Neither has been the case since the bull
market started.
The P/E Ratio for the
S&P 500 was 27.567 as of May 24, 2024, with a median value of 17.895,
according to GuruFocus.
That’s 40.15% greater than the S&P’s P/E of 19.17 on September 30, 2022 (Source:
YCharts), which
was just a few trading days before the bull market started.
The S&P 500 P/E has increased
18.65% Year over Year (last 52 weeks) with the index returning 26.14% (including
dividends) over the same time period. Therefore, P/E
expansion accounted for 71.35% of the S&P’s YoY return and most of that P/E
expansion was due to a few large cap tech stocks.
Huge Tech Sector Influence
on S&P 500 Performance:
In the mid-1980s, the tech
sector accounted for 5 to 7% of the S&P 500’s market cap. As of May 24, 2024, information technology
(IT) stocks make up 29% of the S&P 500 index's value with 9% in communications
services stocks. Together, these two
groups of tech stocks represent more than 38% of the S&P 500.
The Vanguard Information
Technology ETF (VGT) is the largest technology ETF with $66.45 billion
in assets. VGT YoY return was 31.3% vs 26.14% for the entire S&P YoY
return!
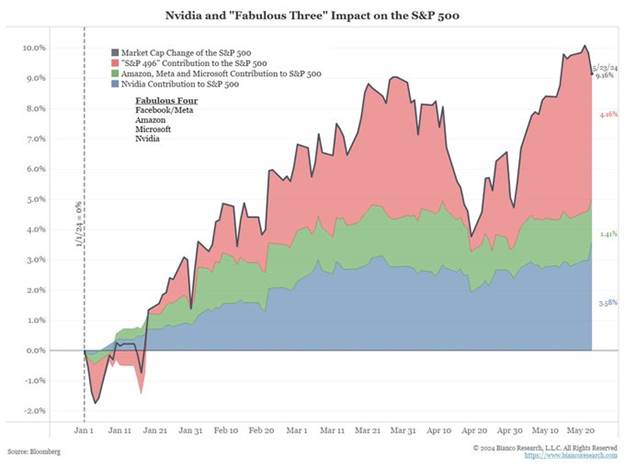
More striking is a Jim Bianco tweet:
The chart shows the change
in the S&P 500's market capitalization, which is a good proxy for the
returns calculated by S&P. This
"simple" market capitalization change is up 9.16% YTD. Incredibly, 3.58%
of this is the gain NVDA. That's 39% of the S&P 500's gain YTD! AMZN, MSFT, and META account for another
1.41% of the S&P 500's gain YTD, or 15%.
Therefore, 54% of the S&P 500's gain YTD is just four stocks!
Dow Theory Divergence:
According to Dow Theory
(popularized by the late Richard Russell), a move in the Dow Jones Industrials
should be confirmed by the Dow Jones Transports (and vice-versa). Yet, while
the DJIA rose to hit the 40,000 level the Friday before last and closed May 24th
at 39,070 (+3.13% YTD), the DJT have declined this year with a -5.13% YTD
return.
Extremely Bullish
Sentiment Rules the Roost:
·
At
12.36 currently, the VIX volatility index is a fraction off its YoY low.
Its long-term average is around 19, a level that essentially prices the S&P
500 index as if it will move about 1.2% each day over the next 30 days. When
the VIX gets really low—as it is right now—the major
stock indexes tend to reach new highs, and investors get greedy. History
suggests that’s a warning sign.
·
Credit spreads (junk bond/U.S. Treasury interest rates) have only been as
tight as they are today twice before – in 2000 and 2007 – just before major
bear markets in U.S. equities. They are now at the bottom decile of all time. Junk
bonds are priced for no defaults even though business bankruptcies have surged
+35% in the past year to the highest level since Q3-2020. The high yield bond ETF (JNK) is +3% YTD vs U.S.
Treasury ETF (TLT) is -7% YTD.
·
Equity strategists have recently boosted their year-end targets for the S&P
500. The Street-high target has moved up to 5,600 from 5,200 to start the year
too. Deutsche Bank and BMO Capital Markets increased their end-of-year S&P
500 targets this past week to 5,500 points and 5,600 points, respectively.
·
Ed Yardeni of Yardeni Research is calling for the Dow to
hit 60,000 points by 2030, a 50% surge from current levels. He predicts the
S&P 500 could be trading at 8,000 points by that time. "That target could be achieved with a
forward [price-to-earnings multiple] of 20 and forward earnings at $400 per
share, up 60% from an estimated $250 per share this year," Yardeni wrote
in a note to clients earlier this week.
·
According
to YCharts, U.S.
Stock Market Investor Sentiment % Bullish is currently at 47.04%, compared
to 40.86% last week and 22.90% last year.
Compare that to 15.84% bullish on April 14, 2022, in the middle of that
9 1/2-month bear market.
U.S. Stocks Rise Despite
No Fed Rate Cuts:
At the start of 2024,
strategists were calling for five to seven Fed rate cuts this year. After the March
20th FOMC meeting, Fed officials projected three rate reductions in
2024, likely starting in June. But given the persistence of elevated
inflation, financial markets now expect just one rate cut this year,
in November, according to futures prices tracked by CME FedWatch
tool.
Despite no rate cuts yet
and much fewer than expected this year, the equity market has advanced with
only a 5% decline in April. That was way short of the >=10% correction many
expected if inflation remained high along with intermediate and long-term interest
rates.
All of this is incredibly
puzzling to the Curmudgeon who has been watching financial markets for over 60
years!
…………………………………………………………………………………………………………..
Be well, success, good
luck and till next time……………………………….
The Curmudgeon
ajwdct@gmail.com
Follow the Curmudgeon on Twitter @ajwdct247
Curmudgeon is a retired investment professional. He has been involved in financial markets since 1968 (yes, he cut his teeth on the 1968-1974 bear market), became an SEC Registered Investment Advisor in 1995, and received the Chartered Financial Analyst designation from AIMR (now CFA Institute) in 1996. He managed hedged equity and alternative (non-correlated) investment accounts for clients from 1992-2005.
Victor Sperandeo is a historian, economist and financial innovator who has re-invented himself and the companies he's owned (since 1971) to profit in the ever changing and arcane world of markets, economies, and government policies. Victor started his Wall Street career in 1966 and began trading for a living in 1968. As President and CEO of Alpha Financial Technologies LLC, Sperandeo oversees the firm's research and development platform, which is used to create innovative solutions for different futures markets, risk parameters and other factors.
Copyright © 2024 by the Curmudgeon and Marc Sexton. All rights reserved.
Readers are PROHIBITED from duplicating, copying, or reproducing article(s) written by The Curmudgeon and Victor Sperandeo without providing the URL of the original posted article(s).