Hawkish Fed Tanks Stocks as Treasury Yields
Flirt with 3%
By the
Curmudgeon
Introduction:
After a review of Friday’s markets, we examine Fed talk’s
huge effect on the markets, Sentiment Trader findings, B of A Global Research
and EPB Macro Research highlights which are illustrated with very relevant
charts. Please let us know what you
think of this post.
Friday’s
Market Summary:
Sparked by
hawkish Fed comments, U.S. stocks tumbled on Friday with the S&P 500
registering its biggest one-day loss in almost seven weeks. The 2.8% decline in the benchmark S&P 500
came a day after Federal Reserve chair Jay Powell said a 0.5% interest rate
rise was “on the table” to combat soaring inflation. The weekly decline was
also 2.8%. The technology-heavy Nasdaq Composite lost 2.6%, for a 3.8% weekly
decline as investors pulled out of growth stocks as inflation expectations have
surged. U.S. stocks are within one or
two percent of the March 2022 lows.
This week,
we saw evidence of a split stock market, with many issues at 52-week highs or
52-week lows. The Nasdaq 100 has gone from year-over-year gains of more than
50% to a negative total return.
The yield on the 10-year Treasury note
(which underpins borrowing costs worldwide) was steady at 2.9%, also close to
its highest level since late 2018. The
yield curve has suddenly surged while investors battle high and rising
inflation. A steepening yield curve is
typically, but not always, associated with more robust economic
conditions. This seems to be an
exception condition as a stronger U.S. economy isn’t likely due to all the
headwinds directly ahead.
Meanwhile, the U.S. dollar index (DXY) closed at
101.22 up 0.64% on the day for a fresh two year high. It was the first close over 101 since the
peak of the coronavirus pandemic in March 2020.
Fed Talks the Talk – This Time the Market Reacts:
Fed Chairman Jerome Powell on Thursday sent his
strongest signal yet that the Fed would raise borrowing costs rapidly to
“fight” inflation which has been accelerating as per this chart:
“It is appropriate in my view to be moving a little more
quickly,” he said at an IMF panel.
“We’re going to be raising rates and getting expeditiously to levels
that are more neutral, and then that are actually tightening policy if that
turns out to be appropriate, once we get there,” Powell added.
Earlier in the week, Federal Reserve Bank of St. Louis
President James Bullard said he wouldn’t rule out the prospect of a
75-basis-point rate hike next month.
Markets are now pricing in a fed funds rate of 2.8% by the
end of the year, up from the current 0.25% and 0.5%. Many pundits say the Fed will raise rates by
50bps at EACH of the next three FOMC meetings.
But look at the ultra-low rates in place since the 2008-2009 financial
crisis, as per this graph:
Apparently, the nonstop, multi-month talk about the Fed
raising interest rates to curb inflation had not been properly discounted by
the equity markets. Why not? For
many years, we’ve said that the market is not a “discounting mechanism”
and perhaps never was. We wrote about
that 10 years ago in this post.
This cartoon captures the Fed’s tricky task of raising rates
to tame inflation without causing a recession:
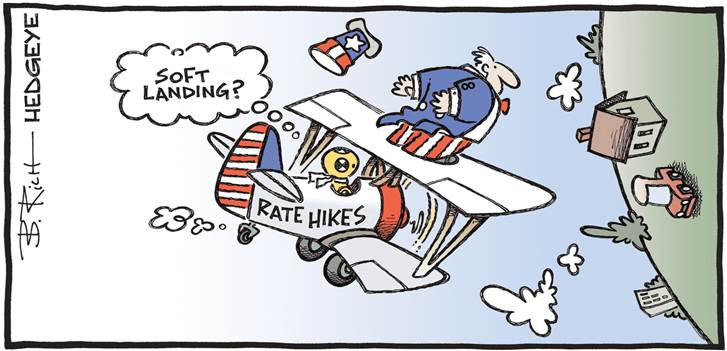
Cartoon Courtesy of Hedgeye
……………………………………………………………………………………………………..
Sentiment Trader on the Split U.S. Stock Market:
One of the requirements for a healthy environment is that
52-week highs on the NYSE must outnumber 52-week lows. That's not happening
with any consistency. Not only that, there is
currently a remarkable split in the market, with too many securities at both
extremes.
The HiLo Logic Index
was above 4% again last Friday, meaning more than 4% of NYSE issues hit a
52-week high, and more than 4% of them fell to a 52-week low. That is not what
bulls want to see.
When the HiLo Logic Index was above
4% since 1965, in the top 1% of all days, the S&P 500's annualized return
was a horrid -22.1% p.a. (per annum, or percent annualized). When it was at the
opposite extreme, the S&P averaged +49.7%.
This has been a familiar problem for months. The 50-day
average of the HiLo Logic has now climbed above 2%,
and the Back test Engine shows that when the 50-day average got this
high, three months later, the S&P 500 was higher only 8 of 22 times.
Returns across every time frame were terrible.
Chart and Table courtesy of Sentiment Trader
….…..……..…..……..…..…..……....…..…..…..…..…..…..……..…..…..……..…..….
Sentiment Trader - Big Tech Stocks Get Crushed:
The air has been let out of the Big Tech balloon. For the first
time in over a year the tech dominated NASDAQ 100 (NDX) index has a
year-over-year loss. This comes on
the heels of what had been a historic rise as shown in this chart:
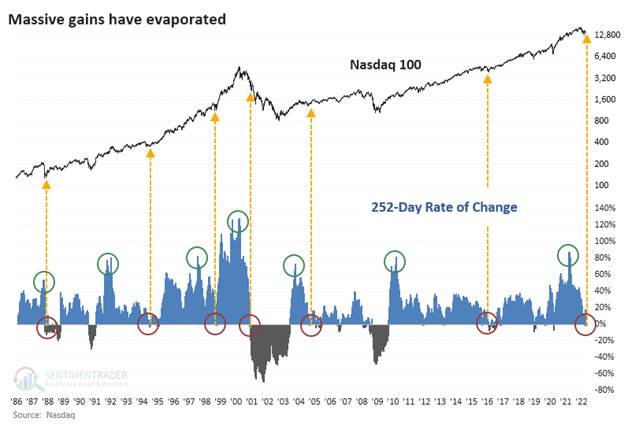
Chart courtesy of Sentiment Trader
…………………………………………………………………………………………..
Cartoon of the Week:
Looks to us that the bear is in control of the market at this time:
U.S. Recession Watch:
Few economists believe the U.S. will be in recession this
year, despite the widely anticipated Fed rate hikes. However, BofA’s Global Fund Manager Survey indicates
optimism around global growth has fallen to an all-time low. 26% of
respondents say a global recession is the greatest “tail risk” for equities
with hawkish central banks a close second at 25%.
Here’s a chart showing the waterfall decline in Financial
Market Stability, courtesy of the BofA Global Research team:
Meanwhile, in a poll carried out on behalf of CNBC last
month, 81% of U.S. adults said they believe a recession is likely in 2022. By
contrast, Goldman Sachs economists recently put the odds of a U.S. recession in
the next year at 20-35%.
The highly respected EPB Macro research
firm thinks the economy is weakening, but a recession is NOT YET
an imminent risk. That may change by
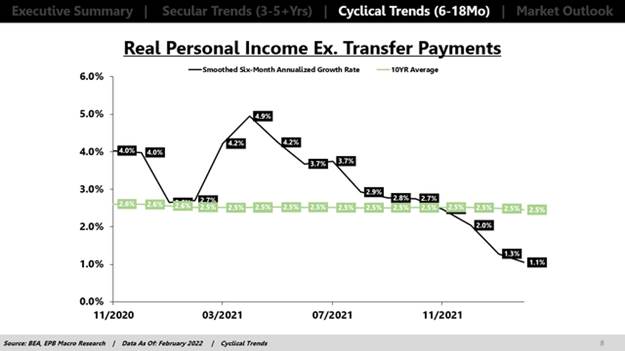
this summer. Here’s EPB’s executive
summary, a look at declining real income growth, and recession risk.
EPB Macro’s Cyclical Leading Indicators Update: April 2022
·
Real growth continues to
decline and will soon fall “below trend.”
·
Inflation pressure continues
to increase, further damaging real income.
·
Lower real income will pull
down consumption and then production/employment.
·
Recessionary odds for 2022
are rising but not yet an imminent risk.
·
Defensive assets will
continue to outperform cyclical assets.
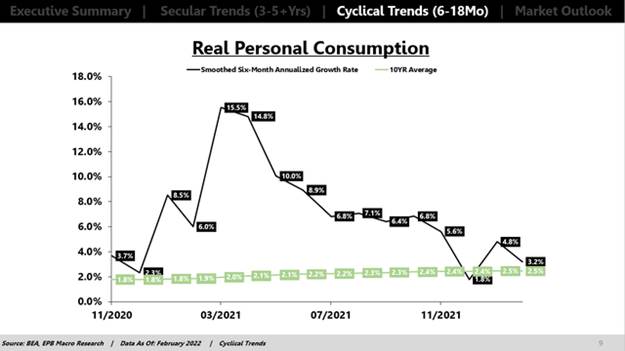
Real income growth is declining sharply and is well below the longer-term trend. Real income growth
will fall even further than shown in the graph below once the March inflation
numbers factor into the data.
Lower real income growth is beginning to pull real
consumption growth down. Within the next couple of months, both real income
growth and real consumption growth will have declined further, falling below
trend, and be close to negative territory.
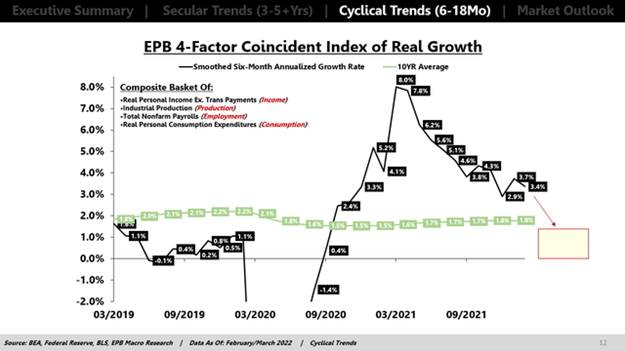
Conclusions:
It will soon become more apparent that U.S. stocks are in a
bear market and that real economic growth will fall closer to the 1% range over
the next three to six months. The Atlanta
Fed GDP Now index is currently forecasting 1.3% GDP growth for the
current quarter.
Once U.S. real economic growth slows into the 1% range,
recession risk is highly elevated which will make for a very bearish stock
market.
EPB’s Eric Basmajian sums up as
follows: “The conditions for a recession will likely be in place by the summer.
By tracing the economic sequence back to its usual origins, we can confirm that
there's limited evidence that an inflection towards higher economic growth is
on the horizon.”
…………………………………………………………………………………………………………
Stay healthy, enjoy life, success, good luck, and best
wishes. Till next time....
The Curmudgeon
ajwdct@gmail.com
Follow the Curmudgeon on Twitter @ajwdct247
Curmudgeon is a retired investment professional. He has been involved in financial markets since 1968 (yes, he cut his teeth on the 1968-1974 bear market), became an SEC Registered Investment Advisor in 1995, and received the Chartered Financial Analyst designation from AIMR (now CFA Institute) in 1996. He managed hedged equity and alternative (non-correlated) investment accounts for clients from 1992-2005.
Victor Sperandeo is a historian, economist and financial innovator who has re-invented himself and the companies he's owned (since 1971) to profit in the ever changing and arcane world of markets, economies, and government policies. Victor started his Wall Street career in 1966 and began trading for a living in 1968. As President and CEO of Alpha Financial Technologies LLC, Sperandeo oversees the firm's research and development platform, which is used to create innovative solutions for different futures markets, risk parameters and other factors.
Copyright © 2022 by the Curmudgeon and Marc Sexton. All rights reserved.
Readers are PROHIBITED from duplicating, copying, or reproducing article(s) written by The Curmudgeon and Victor Sperandeo without providing the URL of the original posted article(s).