Misleading
U.S Economic Data Obscures a Struggling Recovery
by The Curmudgeon
Executive
Summary:
We have three
crucial points to make in this very important article. All are related to what
we believe is flawed reporting of U.S. government economic data:
1. The U.S. Bureau of Economic Analysis (BEA)
initial GDP estimates since the September 2008 financial crash have
consistently been overstated. Later,
they were significantly revised downward, but the mainstream news media hasn't
paid much attention to that, even though the economy was shown to be weaker
than first reported.
2. The BEAs comprehensive (or benchmark)
revision of U.S. national income and product accounts (NIPAs) series - from
1929 through the first quarter of 2013 - seem to be based on faulty assumptions
(described below). They make the recession that "ended" in June 2009
less severe and made the economy's 2012 output 3.6% larger or $559.8B greater
than previously reported (Source: Financial Times).
3. None of the key government released statistics
(e.g. CPI, GDP and unemployment numbers) can be trusted in the first
place. That's because the numbers are
biased and often-manipulated, especially understating inflation, which makes
real GDP better than it really is.
1. Markedly Different Pre and Post-Crash Revisions to GDP:
The BEA's
initial estimates of GDP have been mostly overstated since the summer of
2008. That is the exact opposite of what
occurred prior to that time! Here's the
background:
BEA reports
initial quarterly GDP estimates (known as the "advanced estimate"),
followed by two or three subsequent revisions as more thorough analysis of the
data takes place. The first estimates come out approximately one month after
the end of a particular quarter. The second and third revisions are made
several months thereafter. And now the
analysis:
From 2002 to
mid-summer 2008, the BEA revised initial GDP estimates a total of 25 times, 80%
(or 20 revisions) was higher than their initial estimate. As one might expect,
the average amplitude of the upward and downward revisions were equal at .5%.
In other words, the economy turned out to be stronger than expected, probably
due to the unsustainable real estate boom that went bust big time.
However, since
mid-2008 we have the opposite situation. 67% of the revisions (12 of 18) have
been downward, and those negative adjustments have been, on average, 50% larger
than the upward revisions (.75% vs. .5%).
Since mid-2008, revisions have subtracted a total of 6 % points of
growth off the initial estimates. This works out to an average of 1.3 % of
growth per year that was expected, but never actually happened.
This strongly
implies the post-crash "recovery" has been much weaker than initially
reported. Do you think that's just a
co-incidence or is there politic meddling involved?
Note: The chart above
depicts GDP revisions before and after the Sept 2008 financial crash--courtesy
of Peter Schiff
Peter Schiff
wrote, "The pattern of early optimism may stem from the lack of
understanding in Washington about how monetary stimulus actually retards
economic growth. But there can be little
doubt that these overly optimistic projections have worked wonders on the
public relations front. The big Wall Street firms and the talking heads on
financial TV set the tone by jumping on the new releases and ignoring the
revisions to prior releases. The lack of critical thinking and economic
understanding also play a role."
Indeed, the
main stream media, the public and the politicians seem to pay much more
attention to the initial estimate and mostly ignore the revisions. This creates a misleading situation where the
initial GDP estimates are both the most important and the least reliable.
As an example,
consider the July 31, 2013 GDP announcement.
The media cheered the better than expected 1.7% growth in 2nd quarter
GDP, but either ignored or downplayed the very significant 0.7% downward
revision to 1st quarter GDP - from 1.8% to 1.1%. It's actually worse, because the initial
estimate for 1st quarter GDP (released in April) was 2.5%. Yet the media celebrated the
"good" news of higher than expected 1st quarter GDP, while mostly
ignoring the huge downward revisions to the prior quarter.
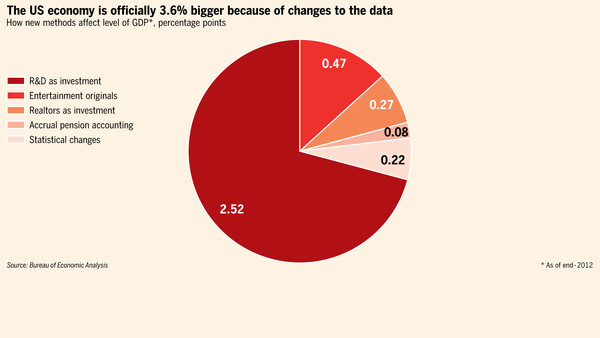
2. New benchmark revisions make the last
recession milder and the economic "recovery" stronger than previously
thought. Corporate
"investment" takes on new meaning!
Revisions of
this scale occur only once every five years when the BEA not only updates its
data, but revises its methods as well and applies the new techniques all the
way back to 1929. The full report- COMPREHENSIVE
REVISION OF THE NATIONAL INCOME AND PRODUCT ACCOUNTS: 1929 THROUGH FIRST
QUARTER 2013 is available at: http://www.bea.gov/newsreleases/national/gdp/gdpnewsrelease.htm.
Articles on the
so called "improvements" incorporated in the revised estimates are
available at BEA’s website at www.bea.gov/gdp-revisions.
The key points
are as follows:
a] Great Recession
now milder by 0.3%: For the period of
contraction from the fourth quarter of 2007 to the second quarter of 2009, real
GDP decreased at an average annual rate of 2.9%. In the previously published estimates, it
decreased 3.2%.
b] Post
recession ("recovery") economy is 0.3% stronger: For 2009–2012, the average annual growth rate
of real GDP was 2.4% or 0.3% higher than in the previously published estimates. The percent change in real GDP was revised up
0.1% for 2010 (2.5%), unrevised for 2011 (1.8%), and up 0.6% for 2012 (2.8%).
c] New
definition of corporate investment: The biggest change in this benchmark
revision is an expanded definition of investment, to include intangible assets
such as research and development (R&D).
By itself that added 2.5 percentage points to the size of the economy,
according to the Financial Times.
“We’re all
about being relevant and that is what this comprehensive revision is about as
well,” Steve Landefeld, the director of the BEA, told
the Financial Times. The goal of the revisions is to better reflect the
changing pattern of the economy.
"Previously, companies invested in machinery. Now they are more
likely to invest in intangible assets such as research," he said.
Curmudgeon’s
Rebuttal: Who believes that? Companies don't invest
in machinery, because they've outsourced/off-shored manufacturing. And research spending, as a percent of
corporate revenues, has been declining for years!
Counting book,
movie and music copyrights as "investment" added another 0.5% to the
size of the economy. Transaction costs when somebody buys a house – such as the
estate agent’s commission – were also moved to investment and added another
0.3% to GDP.
3. The U.S. government is "fudging" the
economic numbers it releases.
Mr. Schiff goes
on to state that even if one focuses on the final GDP estimates, you still
aren't getting the truth. He says,
"All GDP estimates are based on imperfect inflation measurement tools,
which I believe are designed to under report inflation and over report growth.
The most recent GDP projection used an annualized .71% inflation deflator to
arrive at 1.7% growth for 2Q-2013."
Does anyone living in the U.S. believe that inflation is running at
<1% per year?
Note: Chart courtesy of ShadowStats
Mostly as a
result of sharply understated inflation, GDP has been much weaker than the BEA
reports, according to ShadowStats. This is clearly shown in the chart below:
ShadowStats
strongly asserts that unemployment is much, much higher than the government
reports as show in numerous charts on their website.
Their
seasonally-adjusted SGS Alternate Unemployment Rate reflects current
unemployment reporting methodology adjusted for SGS-estimated long-term
discouraged workers, who were defined out of official existence in 1994. That
estimate is added to the BLS estimate of U-6 unemployment, which includes
short-term discouraged workers. The U-6
unemployment rate is the Bureau of Labor Statistics’ (BLS) broadest
unemployment measure, including short-term discouraged and other marginally-attached
workers as well as those forced to work part-time because they cannot find
full-time employment.
Note that the ShadowStat's broad based Alternate Unemployment rate
CONTINUES to rise since the recession "ended" in June 2009, while the
BLS U-6 and U-3 (headline unemployment rate) continue to fall. The CURMUDGEON wonders: who's kidding whom?
Till next time.....................
The Curmudgeon
ajwdct@sbumail.com
Curmudgeon is a retired investment professional. He has been involved in financial markets since 1968 (yes, he cut his teeth on the 1968-1974 bear market), became an SEC Registered Investment Advisor in 1995, and received the Chartered Financial Analyst designation from AIMR (now CFA Institute) in 1996. He managed hedged equity and alternative (non-correlated) investment accounts for clients from 1992-2005.