Picking
Up Nickels in Front of a Steam Roller
by The Curmudgeon
Introduction
Rob Arnott is one of the most respected names in global
investing. Founder & Chairman of
Research Affiliates, Rob’s firm manages and licenses over $150 billion,
including the PIMCO All Asset & All Authority Fund where he has 100%
of his retirement account invested. Mr. Arnott also sub advises mutual funds and ETFs for Schwab, Powershares and Nomura Securities.
In a July
15, 2013 PIMCO webcast for investment advisors, Rob shared his view on
various financial markets, said where the PIMCO All Asset & All Authority
fund was invested and why. This article
summarizes his key points, especially related to U.S. equities. We'll also review what Stephanie Pomboy of MacroMavens told Barron's
this past weekend.
Rob Arnott on the Current Market Environment
On the July
15th call, Rob described the current state of the U.S. stock market as "a
very late stage rally coming off already high valuations." He said he has an "aversion to U.S.
stocks" and has rebalanced his PIMCO All Asset & All Authority fund
(PAUDX or PAUIX) out of risk assets and into what he referred to as "cheap
assets," like emerging market equities and bonds. (The Curmudgeon notes
that "cheap assets" have a decided tendency to get cheaper when they
are in a strong downtrend).
The PAUDX/PAUIX
portfolio is currently 37% in "Risk Off" assets, 22% in Low Beta
assets, 16% in bonds and 21% SHORT U.S. equities (via PIMCO StocksPLUS AR Short Strategy Inst'l
shares). That U.S. stock short position is the fund's largest single holding!
On the webcast,
Mr. Arnott twice said that buying U.S. stocks now
is like "picking up nickels in front of a steam roller." It's simply not worth the risk at this
late stage of the Fed fueled bull market, which he said was not at all healthy
in terms of real economic growth.
PAUDX/PAUIX fund is keeping its "powder dry" by investing in
"market neutral alternative strategies" at this time. The fund "looks to acquire inflation
protection assets at cheaper prices, if they sell off due to talk of
deleveraging and the coming deflation."
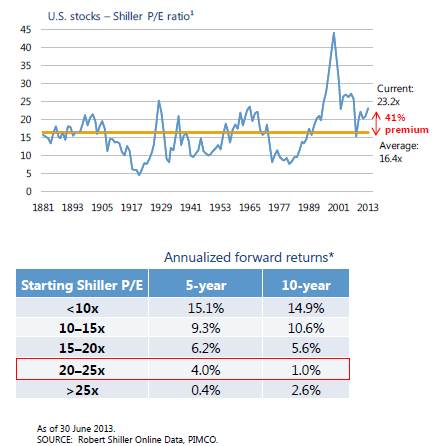
Are stocks
expensive? In the graph
below, U.S. equities, as measured by the S&P 500, are shown to have a Shiller
P/E1 of 23.2 (the latest Shiller P/E-as of July 15, 2016
- is actually 24.6 ). The 23.2 number represents a 43% premium to
its long term average of 16 (the current 24.6 Shiller P/E is 53.75%
premium!). That's also way above the
current S&P 500 P/E of 18.43 and the very controversial "forward
P/E" of 15.
When the Shiller
P/E is in the 20 to 25 range (it's now at the very upper end), U.S. stocks have
had an annualized 4% nominal 5 year return and a 1% annual 10 year return. That's a fact, not a prediction!
![]()
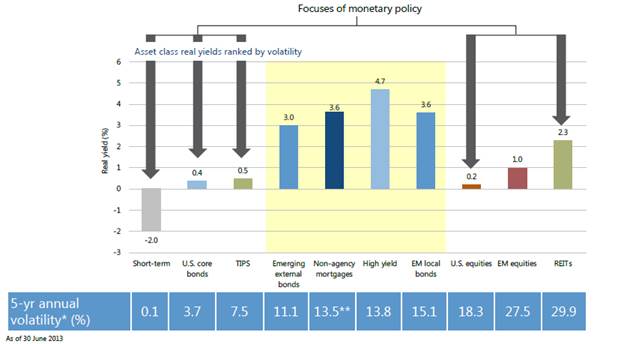
The downward
arrows in the figure below point to the asset classes that have been most
effected (distorted?) by the Fed's QE and Zero Interest Rate Policy
(ZIRP). Rob noted that short term
securities (e.g. 3 month T bills have a negative 2% forward real return - their
nominal interest rate is effectively 0 and there's a 2% annual inflation built
into the price of TIPS. Note also that
U.S. equities (S&P 500) are forecast to have only a 0.2% real yield2,
but have a 5 year annual volatility of 18.3% - not a very good risk/reward
ratio, especially at already expensive valuations as per the Shiller P/E Ratio
described above.
Barron's:
Mission Impossible Ahead- the Fed's job is to end the party, but how can it
do so without crashing the building?
"The credit
market has provided the funding for all the shareholder goodies that have been
holding stocks aloft,” Stephanie Pomboy of MacroMavens told
Barron's Kopin Tan on July 13, 2013.
Between January
and the start of the tapering talk in late May, the stock market added $2.8
trillion in market value. But the size of the U.S. economy expanded just $500
billion, according to Pomboy. Credit issuance during
this stretch totaled almost exactly $2.3 trillion (this is large companies
issuing debt). As rates jumped recently, the pace of monthly credit issuance
shriveled to $58 billion from $260 billion. "If growth - actual and
borrowed - dictates where stocks are headed, then the quartering of issuance in
the last six weeks portends ugly signs ahead," Pomboy
added.
Closing
Comment:
Indeed, second
quarter GDP forecasts have come down significantly and now look to be at or
below 1%. The U.S. stock market is expecting a significant pickup in growth in
the third quarter of 2.5%, and the fourth quarter of 3.0%. With continued
government spending cutbacks (sequester), higher crude oil and gas prices along
with the real estate market likely to slow (due to higher interest rates), it
is extremely difficult for the CURMUDGEON to see any acceleration in GDP or
corporate earnings growth.
But the market
really doesn't care about any of that now.
Only QE and ZIRP matter! We shudder to think what will happen when
"the jig is up?"
Till next time.....................
Notes:
1. The Shiller P/E (popularized by Prof. Robert Shiller and known
more formally as CAPE ratio or P/E-10) is the current price of the Standard
& Poor’s 500-stock index divided by the past decade’s average
inflation-adjusted earnings of the constituents of the index.
2.
The 0.2% real yield on the S&P 500 assumes NO PRICE CHANGE in
the coming year. It's not a total return
forecast, but rather the nominal yield minus the expected annual inflation
rate.
The Curmudgeon
ajwdct@sbumail.com
Curmudgeon is a retired investment professional. He has been involved in financial markets since 1968 (yes, he cut his teeth on the 1968-1974 bear market), became an SEC Registered Investment Advisor in 1995, and received the Chartered Financial Analyst designation from AIMR (now CFA Institute) in 1996. He managed hedged equity and alternative (non-correlated) investment accounts for clients from 1992-2005.