Investment
Pro’s: Clock Ticking on Bubble Markets
By the Curmudgeon with Victor
Sperandeo
Introduction:
For this Memorial Day weekend,
we forego our unique comment and analysis save for Victor’s Conclusions. Instead, we include excerpts of recent
reports which I hope you’ll find valuable and of
special interest. The major theme throughout is how unusual the last 14 months
have been for both pandemic policy responses (Fed and U.S. government) and the
frothy financial markets.
Readers are urged to consider
if this is the new normal and all of financial history
has been repealed? If not, caution and risk control are now more important than
ever.
Excerpts from Noted
Professionals:
Steven Roach, The Ghost of Arthur Burns
The Fed poured fuel on the
Great Inflation by allowing real interest rates to plunge into negative
territory in the 1970s. Today, the federal funds rate is currently more than
2.5 percentage points below the inflation rate (i.e., negative real
interest rate). Now, add open-ended quantitative easing – some $120 billion per
month injected into frothy financial markets – and the largest
fiscal stimulus in post-World War II history. All of this is occurring
precisely when a post-pandemic boom is absorbing slack capacity at an
unprecedented rate. This policy gambit is in a league of its own.
…………………………………………………………………….
Sentiment Trader (via email):
Now that there has been a
spike in inflation gauges, the earnings yield on the S&P 500 has turned
negative. This is not a condition that investors have had to tackle much
over the past 70 years.
When an investor in the
S&P adds up his or her dividend check and share of earnings, then subtracts
the loss of purchasing power from inflation, he or she is barely coming out
even. This is a record low, dating back to 1970, just eclipsing the prior low
from March 2000.
If we ignore dividends, then
there have been five other times when the S&P 500's inflation-adjusted
earnings yield turned negative. The S&P failed to rally more than 7%
at its best point within the next two years after all but one signal.
…………………………………………………………………….
Steve Blumenthal of CMG
Capital Management Group (via email):
If valuations were better and
interest rates higher today, we’d have less reason for
concern (think 2009). Of course, that is not the case at this particular moment in time.
Note the spike in valuations over the last year in this graph:
…………………………………………………………………….
Keith McCullough of Hedgeye (via email):
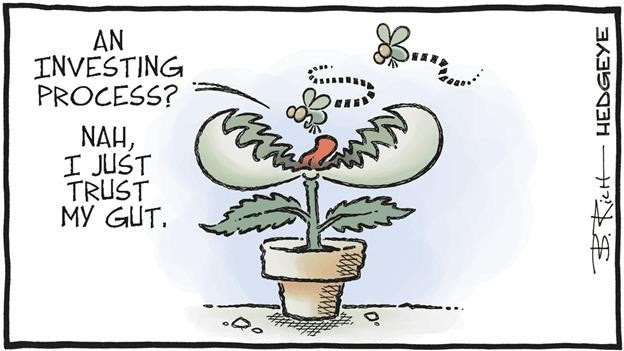
In case
you didn’t already know, being permanently bullish (or
bearish) on Stocks, Gold, Bitcoin, etc. is how many (if not most) fund
managers get paid. They have no repeatable investing process. It’s all about asset gathering and marketing. Gather assets
or fade away into the sunset…
…………………………………………………………………….
Allianz Global Investors' Head
of Global Strategy Stefan Hofrichter: "As we have seen, most – but not all
– of the criteria required for bubbles are waving red flags, and there are many
similarities between the current period and the tech bubble of the late
1990s."
Investor psychology at the moment leads Hofrichter to believe stocks are in a
bubble right now. He said there is too much optimism around the degree of
economic growth in the years ahead, evidenced by the bullish earnings
expectation revisions for some tech firms over the next three-to-five years.
"All financial bubbles in
history took place against the backdrop of 'easy' financing conditions provided
by central banks. In that respect, this bubble indicator is clearly present
today. Central banks have not only cut rates close to zero – or even lower –
but they have flooded the system with levels of liquidity that are
unprecedented in peacetime."
…………………………………………………………………….
Stanley Druckenmiller, USC Student
Investment Fund Annual Meeting Keynote: Why do I say this period is so unique?
Well first
of all, the COVID-induced decline that we experienced last spring was
both violent and abrupt, and, to put it into math terms, we had five times the
decline in the average recession in 25% of the time. Think about that.
Monetary and fiscal policy
response to that was equally unprecedented. It's
not pleasant to remember back last spring, but if you think about that period,
I think we were all terrified that we were experiencing a potential black hole,
not only in our lives, but the but the in the economy itself with potentially
catastrophic circumstances consequences.
If you look at the policy
response it was extremely aggressive, led by the Cares Act. In three months, we
increased the government deficit more than the last five recessions combined.
If you added up all those
recessions’ effect on our budget, and the size of the budget deficit, combined,
they do not equal how much the budget deficit increased in three months last
spring.
The Fed response was equally
aggressive and unprecedented, they did more QE in six weeks last spring, than
they did in the entire period from 2009 to 2018. Which was unprecedented in and
of itself, and a lot of people were questioning the size of that.
The peak month during that
nine-year period was when then Fed Chairman Ben Bernanke did $85 billion in QE,
we're still buying $120 billion (per month) in
securities well after the six weeks that I talked about.
The final thing that happened
last spring was the Fed crossed a lot of red lines in terms of what they
would backstop in terms of the corporate debt. Also in
the municipal market.
The results were very
emphatic: corporations increased their debt in a recession by over a
trillion dollars in response to the Fed backstopping that debt. I don’t believe it’s ever happened before.
Just to put that into
perspective in the great financial crisis, they shrunk their balance sheets
$500 billion, which is much more consistent with historical activity.
The good news is this resulted
(I'd say pleasantly surprisingly) in a very abrupt and
strong recovery. And in that context, it was a good risk reward to enact policy
expecting a deep and protracted recession in the spring of 2020. It worked. It
was dynamic, it was bold.
However, a lot has changed
since then. By the fall, the outlook had already brightened considerably, and
policy makers continue to accelerate fiscal deficits; they are going to reach
30% of GDP and just under two years.
This is a chart of the
cumulative fiscal deficit from the start of the recession, of all the
recessions mentioned earlier, since 1980:
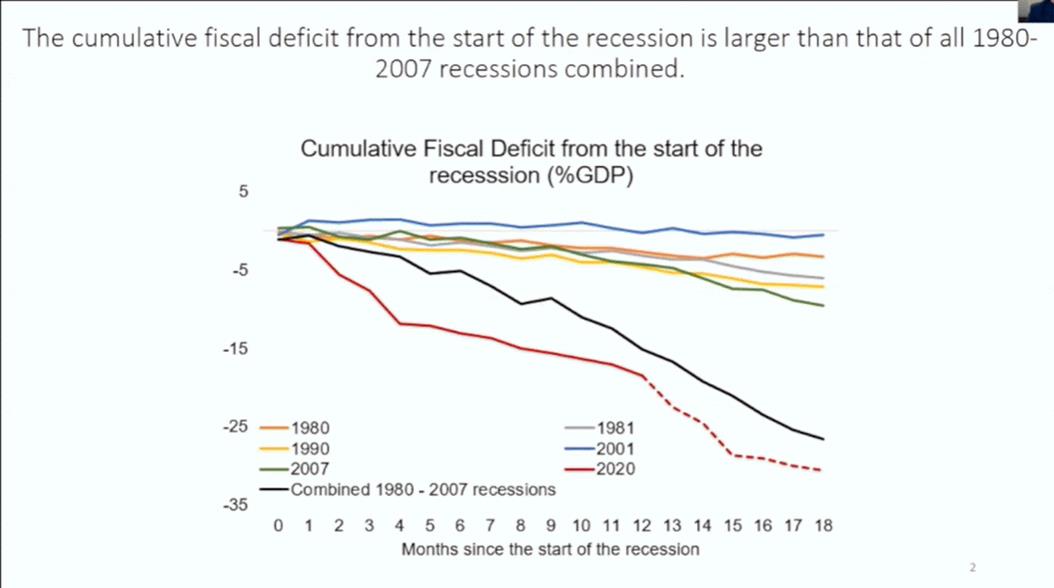
The top five lines are the
four recessions that preceded this one.
The black line represents all those added up together. Remarkably, the
red line is what we're doing in 2020 and 2021.
Again, the boldness of what
they did and the beginning of that chart when you'd
say first five or six or seven months, makes a lot of sense. But what's very surprising, is we're continuing to
double down on these policies, even after it's quite apparent, you've had a
very strong recovery in the economy.
The Fed’s easy money printing
is almost two times all previous fed incursions into money printing.
The Fed is constantly
reminding us of monetary policy ads with long and variable lags.
· Why,
then, is the Fed still providing emergency financial conditions when their
recovery—as I've shown—is in full acceleration?
· Why is
the Fed buying $40 billion in mortgages a month, when we are clearly running
out of housing supply?
· Not
only is the Fed still providing record amounts of accommodation; it is
promising not to raise rates until after 2023. Even when the recession is
already over.
· If the
Fed raised rates in the first quarter of 2024, as indicated, it will be 41
months after recovering 70% of the drawdown and unemployment. That was the
chart I showed with the red line earlier.
· What do
you think the average number of months is before the Fed’s first hike after a
70% employment recovery in the post-war period? Chairman Powell is predicting
41 months before Fed’s first rate hike.
· What do
you think the average after that kind of recovery has been since World War Two?
Four months. Four!
· And
according to the Chair, they are not even thinking about ending $120 billion a
month in bond purchases. Simply put, the fastest and strongest recovery from
any post-war recession is being met with the Fed’s easiest response on record…
by a mile. Policymakers say, “We need to go big to avoid downside risks and
avoid this stagnation experienced after the great financial crisis.”
· But as
I have shown, comparisons with the great financial crisis are completely
inappropriate.
What about the risks of
financial stability? The worst economic periods of the last century have
followed the bursting of asset bubbles––think the 1930s after the 1929 bubble
burst and think about the great financial crisis after the housing bubble
burst.
With Dogecoin, which
was started as a joke, with a $60 billion market cap, and they have NFTs
(non-fungible tokens) on everything you can spell out there, is there any doubt
in anybody's mind that we are in a bubble––not to mention the stock market, and
the GDP is well above any level that we've seen in the
past century?
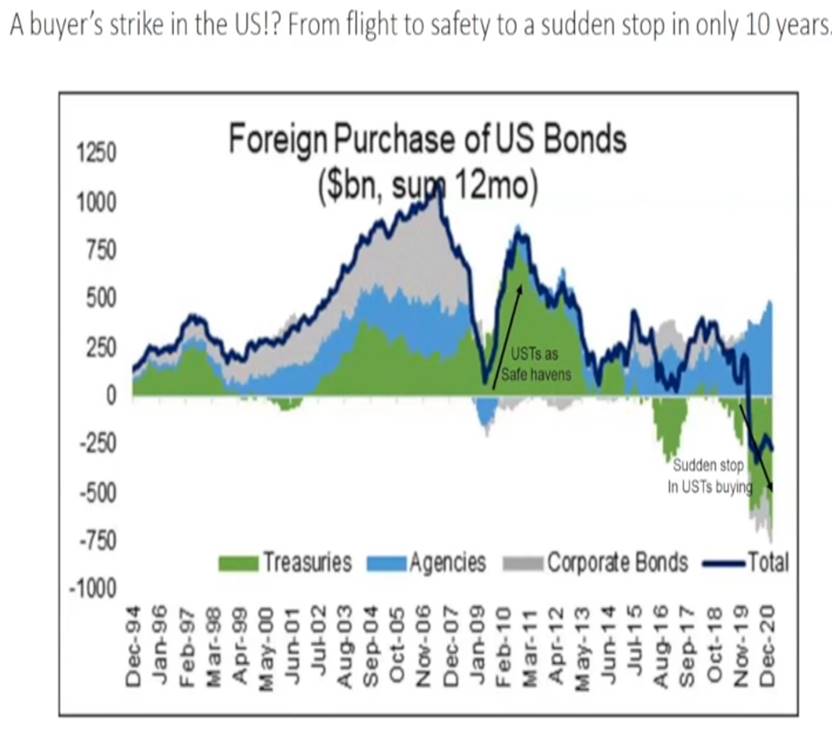
What about the risk of fiscal
dominance and loss of our reserve currency status? Foreigners have started to lose confidence in
the U.S. dollar as they’ve aggressively sold U.S.
Treasuries in the last year. That’s reflected in this
chart:
Asians and others have been
purchasing Chinese assets. China has not done QE and provided much less fiscal
stimulus in response to COVID. Yet
China’s economy and markets are doing just fine while
the Yuan has appreciated.
China represents 20% of world
GDP, but only 1.6% of global portfolios.
The U.S. represents 25% of GDP, but 28% of world portfolios. Do you think those ratios will now change?
…………………………………………………………………….
GMO Quarterly Letter: Speculation and Investment,
by Ben Inker:
Speculative booms provide both
entertainment and outsized profits while they are happening, but they do
generally burst painfully. This is particularly true in equity markets, where
the demand growth is ordinarily met with increased supply from savvy
capitalists. Maintaining excess demand in the face of growing supply becomes
ever more difficult and eventually proves impossible.
In this cycle, the supply
growth (see chart below of U.S. equity issuance) is particularly impressive
in both its scale and the flexibility it has to
migrate wherever speculation is most rampant. That does not seem like a good
sign for an extended continuation of this boom. Whether the end means a fall
for just the more speculative end of the market, or the market as a whole is harder to predict at this point, although even
if the rest of the market holds up for now it will require a difficult economic
balancing act to keep it aloft indefinitely.
U.S. EQUITY ISSUANCE AS
PERCENT OF U.S. GDP:
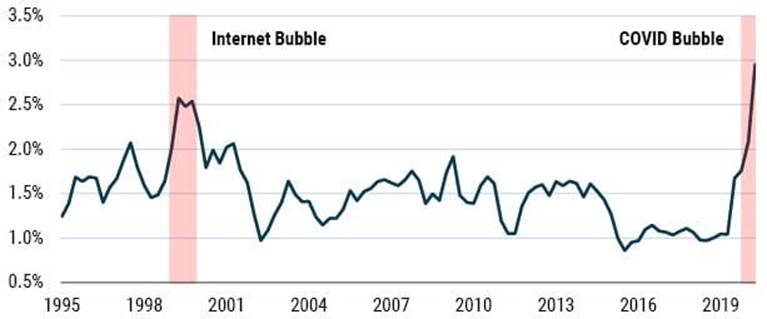
Issuance doubled as a percent
of U.S. GDP at the height of the internet bubble, but the recent burst has been
even more impressive. Not only has the last year seen the highest level of
issuance since the data I’m using began, it did so
from what had been desultory levels over the previous half decade.
The U.S. stock market of
2017-2019 may well have been quite expensive relative to history, but it didn’t show many of the other classic symptoms of a
speculative bubble. That has now changed.
As striking as this burst of
issuance is, I’d argue that the form of the issuance
this time is particularly laser-focused on giving speculators what they hunger
for. SPACs, among their other interesting features, give their promoters the
ability to create more of whatever type of stock is coveted in the market with
impressive speed. And while it is easy to say that the burst in SPAC issuance
in recent months is unprecedented, lots of things are unprecedented.
What makes speculative
bubbles distinct is that the investment side of the equation becomes an
insignificant driver of transactions, with both the rationale for trades and participants’
expectations for returns from them driven overwhelmingly by speculation.
Victor’s Conclusions:
We’ll have
rising consumer prices in the U.S. through at least the end of July. The market
knows that and that real interest rates are deeply negative (as per Steven
Roach’s comments above). While the Fed
is concerned that tapering or raising rates might cause a market crash, it has
recently been draining extra cash in the repo market.
Reuters reports that the amount of money
flowing into the Fed’s reverse repurchase (RRP) facility [1.] hit an
all-time high of $485 billion on Thursday, further repressing key short-term
interest rates, which risk falling below zero. Cash-heavy financial
institutions have been loaning money to the U.S. central bank overnight at 0%
interest in increasing amounts since March.
Note 1. The
Fed launched its reverse repo program in 2013 to soak up extra cash in
the repo market and create a strict floor under market rates, especially its
Fed Funds policy rate.
This move by the Fed is to
show the world that yes, they do care about too much money printing! But this
is just a signal. If they keep rolling
the reverse repos they’ll be draining liquidity, which
will have economic effects. The Fed can
end this drain anytime so the markets will be watching! Beware of the Fed trying to look good to its
critics.
End Quote:
“A market does not culminate
in one grand blaze of glory. Neither does it end with a sudden reversal of
form. A market can and does often cease to be a bull market long before prices
generally begin to break.”
— Jesse Lauriston Livermore
…………………………………………………………………………………………………………………...
Stay safe, be healthy, take
care of yourself and each other, and till next time……
The Curmudgeon
ajwdct@gmail.com
Follow
the Curmudgeon on Twitter @ajwdct247
Curmudgeon is a retired investment professional. He has
been involved in financial markets since 1968 (yes, he cut his teeth on the
1968-1974 bear market), became an SEC Registered Investment Advisor in 1995,
and received the Chartered Financial Analyst designation from AIMR (now CFA
Institute) in 1996. He managed hedged equity and alternative
(non-correlated) investment accounts for clients from 1992-2005.
Victor
Sperandeo is a historian, economist and financial innovator who
has re-invented himself and the companies he's owned
(since 1971) to profit in the ever changing and arcane world of markets,
economies and government policies.
Victor started his Wall Street career in 1966 and began trading for a
living in 1968. As President and CEO of Alpha Financial Technologies LLC,
Sperandeo oversees the firm's research and development platform, which is used
to create innovative solutions for different futures markets, risk parameters
and other factors.
Copyright © 2021 by the Curmudgeon and
Marc Sexton. All rights reserved.
Readers are PROHIBITED from
duplicating, copying, or reproducing article(s) written
by The Curmudgeon and Victor Sperandeo without providing the URL of the
original posted article(s).