Longest S&P Bull Market with Many
Bear Markets; Seasonality Fails in New Era
by the Curmudgeon
Acknowledgement: Many thanks to BoAML Global Research and Doug Ramsey
of Leuthold Group for much of the
research and analysis presented in this article. Also
to John Williams of ShadowStats for his closing comments.
……………………………………………………………………………………………………………………
Longest Bull Market in History:
The current bull market will
become the longest in history this Wednesday, August 22, 2018. Bull markets last an average of approximately
97 months each and gain an average of 440 S&P 500 points. At the last bear market bottom of March 9,
2009, the S&P 500 closed at 676.53.
Friday’s close was 2,850.13 for a total price gain (not including
dividends) of 1,173.6 S&P 500 points, i.e. the price more than quadrupled
during this bull-run!
|
Table 1: The history of US
equity bull markets |
|||
|
Start |
End |
Price return |
Duration (months) |
|
6/1/1932 |
3/5/1937 |
323% |
57 |
|
4/29/1942 |
5/29/1946 |
153% |
49 |
|
6/14/1949 |
8/2/1956 |
265% |
86 |
|
10/22/1957 |
12/12/1961 |
86% |
50 |
|
6/27/1962 |
2/9/1966 |
79% |
44 |
|
10/7/1966 |
11/29/1968 |
48% |
25 |
|
5/26/1970 |
1/11/1973 |
74% |
32 |
|
10/3/1974 |
11/28/1980 |
126% |
73 |
|
8/12/1982 |
8/25/1987 |
229% |
60 |
|
12/4/1987 |
7/16/1990 |
65% |
31 |
|
10/11/1990 |
3/24/2000 |
417% |
113 |
|
10/9/2002 |
10/9/2007 |
101% |
60 |
|
3/9/2009 |
8/15/2018 |
321% |
112 |
|
Average |
|
176% |
61 |
|
Source: BofA Merrill Lynch Global Investment Strategy, Bloomberg |
|||
|
……………………………………………………………………………………………………………………………….. |
|||
By comparison bear markets
since the 1930s have an average duration of only 18 months and an average loss
in value of about 40%. At the latest
bear market bottom, the S&P 500 (which reached a high of 1565.15 on Oct. 9,
2007) lost 57%.
Longest S&P 500 Bull Market …yet Bear Markets
Abound:
Despite this being the
S&P 500 bull market becoming the longest of all-time on Wednesday, BoAML Global Research notes that
there are many grizzly bond, commodity and equity market returns this year:
· Global bonds annualizing worst price
return (-3.5% local currency) since 1999;
· 11 of 21 commodity markets have
experienced "bear" markets;
· 1254 ACWI constituents out of a universe
of 2273 are in bear markets (i.e. down >20%). [iShares MSCI ACWI ETF seeks to track the
investment results of an index composed of large and mid-capitalization
developed and emerging market equities.]
BoAML notes that it’s almost
10 years since Lehman Brothers bankruptcy, yet many assets currently remain
below their Sept 14th 2008 level. Those include: oil, industrial metals, equity
markets in Italy, Spain, Russia, Brazil, Turkey, global equity sectors such as
energy and utilities, and most glaring of all, European and Japanese
banks. “The central banks prevented debt
deflation, but they did not inflate indebted assets,” BoAML wrote.
In light of the recent strength of the U.S. equity market
(dominated by a few stocks), global stocks are down -14% since January
2018.
BoAML states that the U.S.
Treasury yield curve is now <25bps from inversion (which has signaled 7 out
of past 7 recessions). They suspect the
weak U.S. housing market portends a shift in the US macro narrative to peak US
GDP, yields and U.S. dollar in the next 3-6 months. Also, monetary policy stimulus has also
peaked: Central bank asset purchases
were $1.60tn in 2016, but only $2.30tn in 2017 and are just $0.16tn thus far in
2018. By year-end global liquidity will
be contracting, according to BoAML.
Also, corporations have reached peak profitability for this economic
cycle.
BoAML Position:
“Until the Fed blinks (likely
December at the earliest) and until KOSPI and copper indicate that Chinese
policy makers have eased big to stimulate Asian growth, we believe the
double-whammy of Peak Profits and Peak Policy stimulus will overwhelm Bearish
Positioning; we retain defensive, bearish recommendations.”
……………………………………………………………………………………………………………..
Sell in May and Go Away is NOT Working this Year!
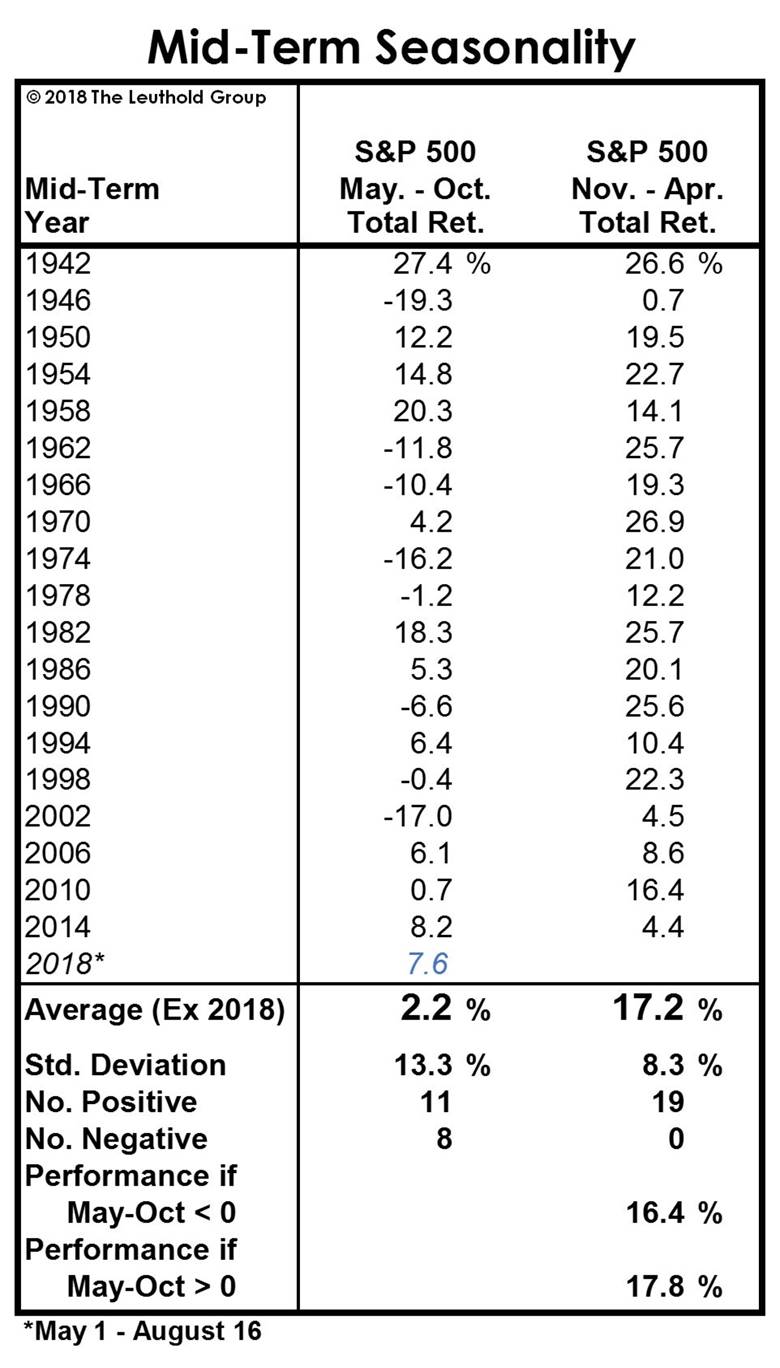
Market seasonality dictates
that the months of May through October, especially in mid-term election years,
have statistically been the weakest six-month window for stocks during the
four-year presidential cycle, with an average S&P 500 total return of just
+2.2% (Chart 1). But so far during 2018, the S&P 500’s total return is
+7.6%. And that’s with the statistically
best six months of the presidential cycle now lay only 2 1/2 months away.
Or as Victor and I have said
previously, “the 4-year presidential
cycle” is dead. It evidently no
longer applies (like so many other time-tested rules, metrics and gauges) in
this “new era for financial markets.”
……………………………………………………………………………………………………………
Leuthold Group found that
since 1942, the mid-term year’s six-month window, beginning in November of the
mid-term year and extending through April of the pre-election year, has seen an
average un-annualized S&P 500 total return of +17.2%. Indeed, none of the 19 six-month windows in
this study saw a total return LOSS.
That’s impressive!
To Leuthold Group’s surprise,
returns in the six-month periods beginning with the mid-term election were
lower when majority power changes. [In this mid-term election year, it would be
the Democrats regaining control of Congress from the Republicans.] The average
November-April S&P 500 total return in those cases has been +10.2%, compared
with an average +21.3% return when there’s no shift in Congressional
power.
Doug Ramsey of Leuthold
concludes this research piece by stating: “But plenty can happen before this
bullish window opens around election time.”
Leuthold tactical funds (the
Curmudgeon has a long-term position in Leuthold Core- LCORX) are still
positioned with net equity exposure of 43-44%.
…………………………………………………………………………………………………………..
ShadowStats
John Williams Outlook for the Economy and Financial Markets:
“U.S. Dollar and
Financial-Market Turmoil Remain at Intensified High Risk, Amidst Mounting
Fiscal Concerns, Consumer Liquidity Issues and Non-Expanding, Real-World
Economic Activity. In the context of
weakening consumer-liquidity trends, the headline economic outlook should
continue to dim rapidly, despite the big initial headline jump in
second-quarter GDP.
Indeed, the dollar and
financial markets remain at extraordinarily-high
risk of intense, panicked declines, possible at any time. Holdings of
physical gold and silver remain the ultimate hedges—stores of wealth—for
preserving the purchasing power of one’s U.S. dollar assets, during times of
high inflation and currency debasement, and/or political- and financial-system
upheaval.”
……………………………………………………………………………………………………………………….
Good luck and till next time…
The Curmudgeon
ajwdct@gmail.com
Follow the
Curmudgeon on Twitter @ajwdct247
Curmudgeon is a retired investment professional. He has
been involved in financial markets since 1968 (yes, he cut his teeth on the
1968-1974 bear market), became an SEC Registered Investment Advisor in 1995,
and received the Chartered Financial Analyst designation from AIMR (now CFA
Institute) in 1996. He managed hedged equity and alternative
(non-correlated) investment accounts for clients from 1992-2005.
Victor Sperandeo is a
historian, economist and financial innovator who has re-invented himself and
the companies he's owned (since 1971) to profit in the ever changing and arcane
world of markets, economies and government policies. Victor started his Wall Street career in 1966
and began trading for a living in 1968. As President and CEO of Alpha Financial
Technologies LLC, Sperandeo oversees the firm's research and development
platform, which is used to create innovative solutions for different futures
markets, risk parameters and other factors.
Copyright © 2018 by the
Curmudgeon and Marc Sexton. All rights reserved.
Readers are PROHIBITED from
duplicating, copying, or reproducing article(s) written
by The Curmudgeon and Victor Sperandeo without providing the URL of the
original posted article(s).