Mega Tech Stock Weighting and Outsized
Gains Makes NASDAQ
and S&P 500 Dangerously Undiversified. Will ETFs Accelerate a Tech-Led
Crash?
by the Curmudgeon
Introduction:
The tech-heavy Nasdaq Composite has notched one record high after another
in the 2nd quarter 2018, while other major U.S. indexes have lagged
behind. The Nasdaq was up 6.2%
this past quarter and has hit a series of all-time highs in June. Other popular
averages and sectors have lagged and (except for the Russell 2000) are well
below their January 2018 highs.
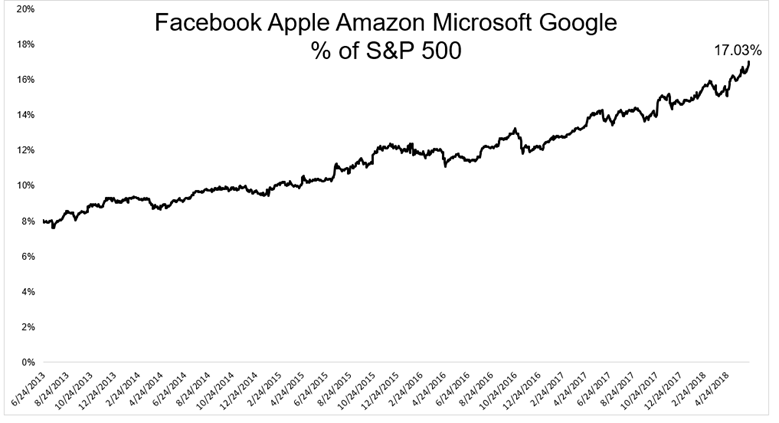
Over the past five years,
Facebook, Apple, Amazon, Microsoft and Google had their market cap grow from
$1.2 trillion to near $4 trillion. These
five tech stocks gained 43% last year, increasing by more than $1 trillion in
market cap.
Five years ago, these stocks
represented 8% of the S&P 500. Today that’s grown to 17% as per this chart:
“A lot of the investing public is piling into
the same things,” said Jim Paulsen, PhD and chief market strategist at Leuthold
Group, who told the WSJ that the
S&P 500 would be mostly flat this year without technology companies. “There’s a lot of sheep following one
another,” he added.
…………………………………………………………………………………………………………………………………………
SIDEBAR:
Netflix is
an extreme case in point. The stock is
up 104% this year, to a recent $391,
and 161% over the past 12 months. Almost 60% of 42 analysts covering the
company have a Buy rating, even though the stock has blown right past the
average price target of $354. Netflix trades at 137 times earnings-per-share
estimates for 2018.
In reality, Netflix is not a
tech stock as their only “technology” is video streaming software which runs on
Amazon Web Servers. They don’t design or
make any products, like Amazon and Google do. We classify Netflix as a video
content distribution company with a P/E of 137???
…………………………………………………………………………………………………………………………………………
Tech Stocks and the S&P 500:
Tech’s growing dominance has skewed the broader S&P 500 index
away from defensive stocks—sectors such as utilities, consumer staples and
health care—that investors have traditionally gravitated towards during bouts
of market volatility. That has left some analysts concerned that investors in
index-tracking funds could be dangerously exposed to a pullback (more on the
Paulsen piece below).
The degree of defensiveness
within the S&P 500, which Leuthold
Group calculated by using the percentage of the index’s market
capitalization comprised of defensive sectors, has fallen nearly 60% from 1991 through early June, according to the
group’s data. That has increased the weighting of highflying tech growth stocks
within the S&P 500, reducing its overall effectiveness as a diversified
portfolio for investors who opt to passively track the broad index, Mr.
Paulsen said. The S&P 500 is “not
the same index it was when your father bought it,” he added.
Jim Paulsen on Tech Stocks Contribution to S&P 500
Top Winners:
Excerpts of a June 25th
blog post by Paulsen (Institutions are strongly encouraged to subscribe to Leuthold Group’s research – contact Marty Owens to inquire):
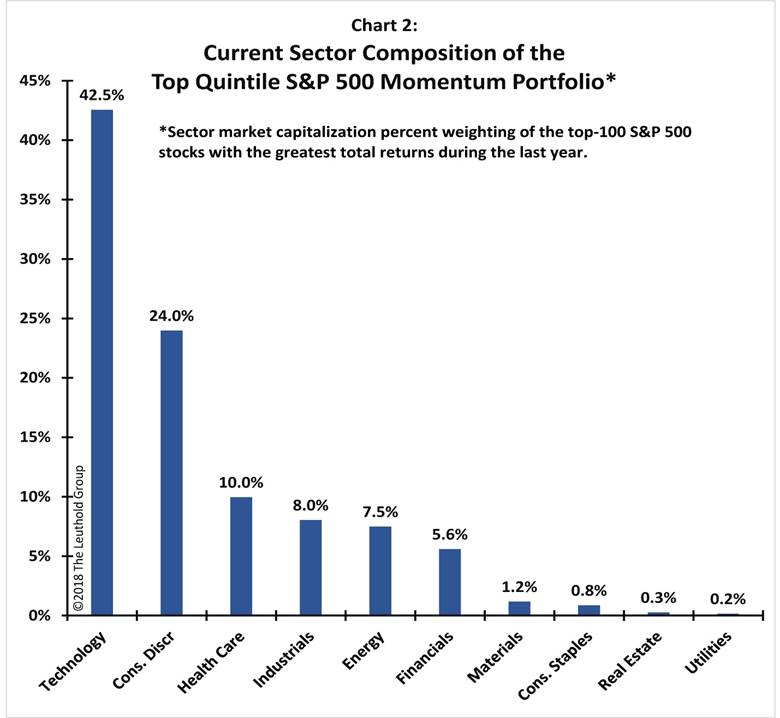
Chart
2 shows current sector weightings of the top quintile S&P 500 Momentum
portfolio. Currently, technology stocks comprise about 26% of the S&P 500
market capitalization, but in the last year they accounted for almost 43% of the market capitalization of the top
100 performers (i.e., the winners’ portfolio). That is, the Technology
sector is about two-thirds more strongly represented among the winners’
portfolio than it is in the overall S&P 500 index (i.e., 43% versus 26%).
Moreover, this chart significantly understates just how concentrated investment
success has become.
Chart
3 shows a strikingly narrower profile to the composition of the S&P 500 MOM
portfolio if only two popular names (Netflix and Amazon) are moved from the Consumer
Discretionary sector to the Technology sector. With this assumption,
“technology” comprises almost 60% of the winners’ portfolio in the last year
(or almost two times its weighting in the overall index)! For comparison, Chart
4 shows the composition of the top quintile momentum portfolio at the peak of
the dot-com stock market—on March 23, 2000. At that point, technology stocks
had comprised about 68% of the winners’ portfolio over the previous year (or
also about two times the 35% weighting of technology stocks within the overall
S&P 500 back then).
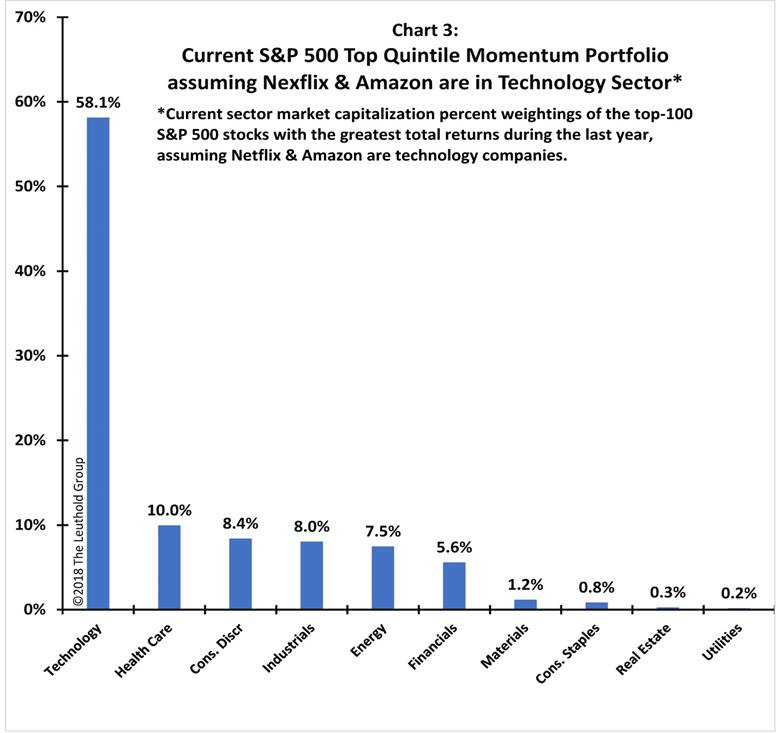
Over
the last year, the degree to which technology stocks have come to dominate the
“winners’ portfolio” illustrates the increasing narrowness of participation
within the large cap S&P 500 universe and is reminiscent of the latter
stages of the dot-com boom.
………………………………………………………………………………………………………………………………………………………………..
Are Tech Stock Investors Prepared for a Pullback or Rout?
The one-directional nature of
the stock rally has left investors increasingly worried that a market whose
gains have been heavily dependent on technology stocks could reverse sharply in
the second half of the year.
Tech stocks tend to react
more quickly to market anxiety than broader indexes, analysts say. Investors are also wary of steeper declines
ahead—and of watching some of their gains slip away. Options investors are
bracing for more volatility based on the difference between implied
volatility—what investors expect—and realized volatility—or what has happened
in the market already—on the $21 billion Technology
Select Sector SPDR exchange-traded fund (XLK). This spread is the highest
among all groups within the S&P 500, according to Macro Risk Advisors in a June 25 note.
Also of note is that investors pulled $29.3 billion from
U.S. stock funds and exchange-traded funds in the week ended June 27, according
to Bank of America Merrill Lynch. It
was the largest such outflow since February. The vast majority
of that money went into money-market funds.
“Whenever the market narrows
like this and everyone wants to own the same stocks like
the [FAANG—Facebook, Amazon, Apple Inc., Netflix Inc. and Alphabet Inc.]
stocks, there is a feeding frenzy that can go on for a while,” said Mike Balkin, a portfolio manager at William Blair. “When it
ends, it usually doesn’t end well.”
ETFs May be the Real Culprit in the Next Tech led
Stock Market Decline:
Our colleague Tim Quast,
President of Modern IR has pounded the table
(much like the Curmudgeon) that ETFs are dangerous derivatives that are
potential weapons of mass destruction.
Since so many index ETFs largely track tech stocks, an ETF selloff could
spark a “tail wagging the dog” stock market rout that would have an avalanche
effect.
Agreeing with that scenario, Satyajit Das of Bloomberg
wrote
last week (bold font added):
The
popularity of ETFs has soared in the past decade. The proportion of U.S.
equity-fund assets that are passively managed has nearly doubled in that time
to nearly 40 percent.
ETFs,
however, are riskier than many investors appreciate. With cap-weighted indices,
for instance, funds have no choice but to load up on stocks that are already
overweight (and often pricey) and neglect those already underweight. As prices
have risen, investors may become overexposed to a few large securities, such as
the big tech companies which now dominate major U.S. indices. That’s the
opposite of “buy low, sell high.”
ETFs
can replicate indices in complicated ways. Rather than purchasing all the
assets consistent with index weights, some funds use a sub-set, thus exposing
investors to tracking error. Others use derivatives, creating credit exposure
to the counterparty. Some ETFs use leverage to enhance returns. Like other
funds, ETFs can lend out the fund’s securities to short-sellers, which creates
exposure to the return of the borrowed assets. ETFs must be fully invested and
therefore hold minimal cash, which could limit flexibility in a downturn. The
rules governing indices can be changed, sometimes arbitrarily.
Worse,
the ways in which ETFs — by their design and their sheer size — are warping markets aren’t well-understood.
ETFs encourage concentration in a few,
liquid, large-cap stocks, creating homogenous and momentum-following
markets. The focus on driving down costs requires ETFs to emphasize scale,
further exacerbating concentration. Markets become susceptible to flows from a
few, large, passive products.
Artificial
factors, such as inclusion or exclusion from an index, forces buying and
selling; this can lead to misallocations of capital. In the current equity
cycle, for instance, over-weighted, liquid, large-cap stocks have benefited
disproportionately from forced buying. This increases the risk of bubbles, as
in 2000.
ETFs
may even distort valuations outright. For one thing, they don’t analyze prices,
meaning that they don’t contribute to price discovery. They arguably weaken
corporate activism, as passive owners have little interest in corporate
governance. Finally, ETFs increase
volatility and shrink liquidity.
What
investors should be worrying about now is how resilient ETFs will be when
conditions change. In every crisis, untested structures have revealed hidden
weaknesses which have threatened wealth and financial stability. There’s no
reason to think next time will be any different.
Conclusions:
We were somewhat surprised by
the lead story in (perpetually bullish) Barron’s
magazine: The Bull’s Last Stand- How to Prepare (July 2, 2018 pp 12-14). Predictably, it’s all about fundamental
economic analysis and fiscal stimulus petering out by 2020. Not about any of the unpublicized dangers
Victor and I have written about for the past five plus years! Author Ben Levinsohn
makes no mention the risk of owning non-diversified index funds or ETFs. Nor does he even suggest lightening up on
tech stocks.
Guess that’s a sign of the
times from the mainstream media and justifies why there needs to be a “voice in
the wilderness” that attempts to inform and educate the public on a variety of
important financial and economic topics or issues. Do you
agree or disagree?
Good luck and till next
time……
The Curmudgeon
ajwdct@gmail.com
Follow the
Curmudgeon on Twitter @ajwdct247
Curmudgeon is a retired investment professional. He has
been involved in financial markets since 1968 (yes, he cut his teeth on the
1968-1974 bear market), became an SEC Registered Investment Advisor in 1995,
and received the Chartered Financial Analyst designation from AIMR (now CFA
Institute) in 1996. He managed hedged equity and alternative
(non-correlated) investment accounts for clients from 1992-2005.
Victor Sperandeo is a
historian, economist and financial innovator who has re-invented himself and
the companies he's owned (since 1971) to profit in the ever changing and arcane
world of markets, economies and government policies. Victor started his Wall Street career in 1966
and began trading for a living in 1968. As President and CEO of Alpha Financial
Technologies LLC, Sperandeo oversees the firm's research and development
platform, which is used to create innovative solutions for different futures
markets, risk parameters and other factors.
Copyright © 2018 by the
Curmudgeon and Marc Sexton. All rights reserved.
Readers are PROHIBITED from
duplicating, copying, or reproducing article(s) written
by The Curmudgeon and Victor Sperandeo without providing the URL of the
original posted article(s).